BASIC TECHNIQUES
Market Maxims
Support & Resistance Axioms
Here are seven axioms for the practical application of support and resistance levels to your trading.
Support and resistance are of central importance to all traders and a necessary starting point for new traders. There are self-evident truths concerning support and resistance of financial markets, so let us examine some of these axioms for their practical application to trading.
Axiom 1
The concept of support and resistance is important because traders believe it is important.
The belief is self-fulfilling. Traders are certain, for example, that the violation of an established high means that the security will likely go higher. Likewise, when a significant low has been penetrated, traders believe that the market in question will go lower. They hold these beliefs because it happens over and over again.
Traders act on their beliefs about how the market moves. Therefore, when they see that the market is bouncing off support, others with the same belief will join in and buy that particular market. That sends the market in an upward direction.
Axiom 2
The longer the time frame, the more significant the support and resistance level.
Common time frames are:
- Five-minute
- 15-minute
- 60-minute
- Daily
- Weekly
- Monthly
Support and resistance levels take on greater importance with longer time frames. Financial markets can be visualized like a funnel: the higher you go, the wider the funnel becomes. Fewer people are trading one-minute charts compared to those trading a longer time frame.
If you are daytrading a five-minute chart and the tradable is approaching a support level, and your 15- and 60-minute charts also show that this same level is an important support level, you may have an entry at that level if support is broken. If that support is broken, that security could plummet for a very nice profit on all three charts. This occurs because you have all the combined traders of the five-, 15-, and 60-minute charts watching and acting upon that price action, not just the five-minute chart traders.
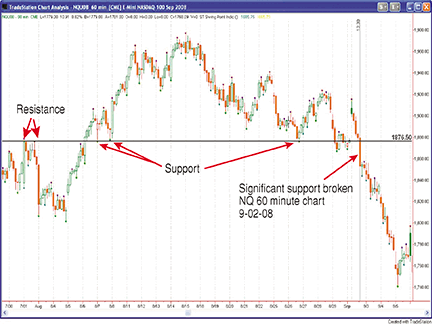
FIGURE 1: 60-minute chart of nasdaq emini (nq). The NQ held support until it was penetrated on August 29, 2008. It then pulled back on September 2 and broke below.
Three charts — the 60-, 15-, and five-minute charts of the Nasdaq (NQ) emini contract — show trade entry when all three charts break support at the same time. The 60-minute chart (Figure 1) shows the NQ holding support until it was penetrated on August 29, 2008, followed by a pullback on September 2, when it smashed through.