TRADING TECHNIQUES
Trends And Opportunity
Entering Trades At Pullbacks
When opportunities knock, tell them to come in! Here’s how pullbacks in trends offer opportunity.
Anybody who has ever bought an asset, whether it’s bonds, stocks, mutual funds, or real estate, knows that prices go up and down. Prices fluctuate between support and resistance most of the time. This is information that technical analysts use for trend trading and countertrend trades. A countertrend trade is also known as a scalp trade. As price moves back to support in an uptrend, or up to resistance in a downtrend, there is an opportunity to make money in the trend.
Let’s look at trend dynamics to understand how to make entries into a trend by entering at pullbacks.
Following the move
One aspect of technical analysis is the study of price activity and trend. Traders cannot control price, but how they react to its movements is the difference between profit, a small loss, and a large loss. Using a trendline can help you identify a trend, a pullback in a trend, and when a pullback becomes a reversal. A trendline will also give you an objective way to manage risk.
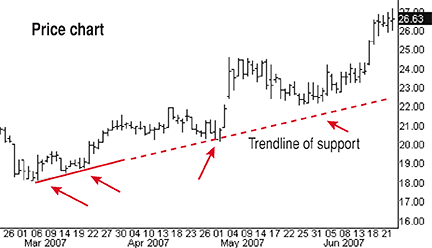
Figure 1 shows a price chart, pivots, and a trendline. The arrows point to pivot lows. It takes a minimum of two pivot points to draw a trendline. The solid line is the start of the trendline connecting a pivot low and a higher pivot low. The extension of the line (dotted) shows the trendline as visual support.

FIGURE 1: pivots and trendlines. By connecting the pivot lows you can form an up-trendline.
We cannot know what price will do. We must know what we will do in reaction to price. Once we have drawn the trendline, a long trade is valid above the uptrend line and stopped out if price moves below the trendline. The uptrend in Figure 1 shows the prevailing direction of price. A trader may take profit at a reversal with the preparation for a pullback to support, also known as a scalp trade.