TRADERS’ TIPS
October 2009
Here is this month’s selection of Traders’ Tips, contributed by various developers of technical analysis software to help readers more easily implement some of the strategies presented in this and other issues.
Other code appearing in articles in this issue is posted in the Subscriber Area of our website at https://technical.traders.com/sub/sublogin.asp. Login requires your last name and subscription number (from mailing label). Once logged in, scroll down to beneath the “Optimized trading systems” area until you see “Code from articles.” From there, code can be copied and pasted into the appropriate technical analysis program so that no retyping of code is required for subscribers.
You can copy these formulas and programs for easy use in your spreadsheet or analysis software. Simply “select” the desired text by highlighting as you would in any word processing program, then use your standard key command for copy or choose “copy” from the browser menu. The copied text can then be “pasted” into any open spreadsheet or other software by selecting an insertion point and executing a paste command. By toggling back and forth between an application window and the open web page, data can be transferred with ease.
This month’s tips include formulas and programs for:
- TRADESTATION: VOLUME-WEIGHTED MACD HISTOGRAM
- eSIGNAL: VOLUME-WEIGHTED MACD HISTOGRAM
- WEALTH-LAB: VOLUME-WEIGHTED MACD HISTOGRAM
- AMIBROKER: VOLUME-WEIGHTED MACD HISTOGRAM
- NEUROSHELL TRADER: VOLUME-WEIGHTED MACD HISTOGRAM
- WORDEN BROTHERS’ STOCKFINDER: VOLUME-WEIGHTED MACD HISTOGRAM
- AIQ: VOLUME-WEIGHTED MACD HISTOGRAM
- TRADERSSTUDIO: VOLUME-WEIGHTED MACD HISTOGRAM
- STRATASEARCH: VOLUME-WEIGHTED MACD HISTOGRAM
- TRADINGSOLUTIONS: VOLUME-WEIGHTED MACD HISTOGRAM
- TRADECISION: VOLUME-WEIGHTED MACD HISTOGRAM
- TRADE NAVIGATOR: VOLUME-WEIGHTED MACD HISTOGRAM
- SWINGTRACKER: VOLUME-WEIGHTED MACD HISTOGRAM
- NEOTICKER: VOLUME-WEIGHTED MACD HISTOGRAM
- UPDATA: VOLUME-WEIGHTED MACD HISTOGRAM
- NINJATRADER: VOLUME-WEIGHTED MACD HISTOGRAM
- WAVE59: VOLUME-WEIGHTED MACD HISTOGRAM
- VT TRADER: VOLUME-WEIGHTED MACD HISTOGRAM
- TRADE IDEAS: VOLUME-WEIGHTED MACD HISTOGRAM
- METASTOCK: VOLUME-WEIGHTED MACD HISTOGRAM (Hawkins Article Code)
![]() TRADESTATION: VOLUME-WEIGHTED MACD HISTOGRAM
TRADESTATION: VOLUME-WEIGHTED MACD HISTOGRAM
The article “Volume-WeightedMacdHistogram” by David Hawkins in this issue suggests a method of incorporating volume data in the moving average convergence/divergence (Macd) histogram.
The article compares the standard Macd difference histogram (Macd_Diff) to a volume-weighted Macd difference histogram (VW_Macd). (See Figure 1.) Code for both is provided here. To display the VW_Macd and signal line, change the input “DisplayVW_Macd” to true.
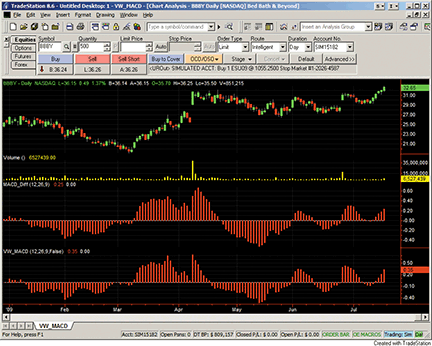
Figure 1: TRADESTATION, volume-weighted MACD (VW_MACD) Vs. standard MACD. Here is an example of Hawkins’ volume-weighted moving average convergence/divergence indicator (VW_MACD) compared to the standard MACD display. The price history of Bedroom Bath & Beyond (BBBY) is displayed in subgraph 1 (top). BBBY’s volume history is in subgraph2. The Hawkins’ MACD difference (MACD_Diff) is shown in subgraph 3, and his volume-weighted MACD (VW_MACD) is at the bottom, in subgraph 4.
To download the EasyLanguage code for this study, go to the TradeStation and EasyLanguage Support Forum (https://www.tradestation.com/Discussions/forum.aspx?Forum_ID=213). Search for the file “VW_Macd.eld.”
This article is for informational purposes. No type of trading or investment recommendation, advice or strategy is being made, given or in any manner provided by TradeStation Securities or its affiliates.
Indicator:  VW_MACD
inputs:
	FastLength( 12 ),
	SlowLength( 26 ),
	VW_MACDLength( 9 ),
	DisplayVW_MACD( False ) ;
variables:
	MyVolume( 0 ),
	VW_MACD( 0 ),
	VW_MACDAvg( 0 ),
	VW_MACDDiff( 0 ) ;

if BarType >= 2 and BarType < 5 then { not tick/minute data nor an advanced chart
	type (Kagi, Renko, Kase etc.) }
	MyVolume =  Volume
else { if tick/minute data or an advanced chart type;  in the case of minute data,
 also set the "For volume, use:" field in the Format Symbol dialog to Trade Vol or
 Tick Count, as desired;  when using advanced chart types, Ticks returns volume if
 the chart is built from 1-tick interval data }
	MyVolume =  Ticks ;

VW_MACD = ( XAverage( MyVolume * Close , FastLength )
	/ XAverage( MyVolume, FastLength ) )
	- (XAverage( MyVolume * Close , SlowLength )
	/ XAverage( MyVolume, SlowLength)) ;
VW_MACDAvg = Average( VW_MACD, VW_MACDLength ) ;
VW_MACDDiff = VW_MACD - VW_MACDAvg ;

if DisplayVW_MACD then
	begin
	Plot1( VW_MACD, "MACD" ) ;
	Plot2( VW_MACDAvg, "MACDAvg" ) ;
	end ;
Plot3( VW_MACDDiff, "MACDDiff" ) ;
Plot4( 0, "ZeroLine" ) ;


Strategy:  MACD_Diff
inputs: FastLength( 12 ), SlowLength( 26 ), MACDLength( 9 ) ;
variables: MyMACD( 0 ), MACDAvg( 0 ), MACDDiff( 0 ) ;

MyMACD = MACD( Close, FastLength, SlowLength ) ;
MACDAvg = XAverage( MyMACD, MACDLength ) ;
MACDDiff = MyMACD - MACDAvg ;

Plot1( MACDDiff, "MACDDiff" ) ;
Plot2( 0, "ZeroLine" ) ;
![]() eSIGNAL: VOLUME-WEIGHTED MACD HISTOGRAM
eSIGNAL: VOLUME-WEIGHTED MACD HISTOGRAM
For this month’s Traders’ Tip, we’ve provided the formula, “VolWeighted_MacdHist.efs,” based on the formula code from David Hawkins’ article in this issue, “Volume-Weighted Macd Histogram.”
The formula plots the volume-weighted Macd histogram (Figure 2). It contains parameters that may be configured through the Edit Studies option to change the long, short, and smoothing periods.
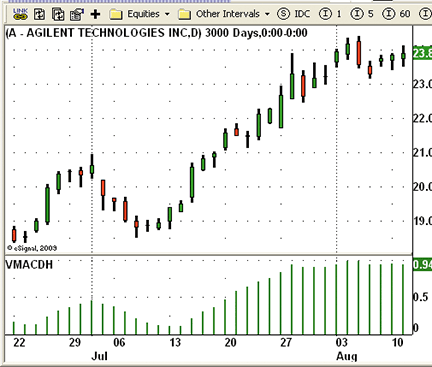
Figure 2: eSIGNAL, volume-weighted Macd histogram
/*********************************
Provided By:
    eSignal (Copyright c eSignal), a division of Interactive Data
    Corporation. 2009. All rights reserved. This sample eSignal
    Formula Script (EFS) is for educational purposes only and may be
    modified and saved under a new file name.  eSignal is not responsible
    for the functionality once modified.  eSignal reserves the right
    to modify and overwrite this EFS file with each new release.

Description:  The Volume-Weighted MACD Histogram

Version:         1.0  07/07/2009

Formula Parameters:     Default:
    Long Period               26
    Short Period              12
    Smoothing Period       9

Notes:
    The related article is copyrighted material. If you are not a subscriber
    of Stocks & Commodities, please visit www.traders.com.

**********************************/

var fpArray = new Array();
var bInit = false;
var bVersion = null;

function preMain() {
    setPriceStudy(false);
    setShowCursorLabel(true);
    setShowTitleParameters(false);
    setStudyTitle("VMACDH");
    setPlotType(PLOTTYPE_HISTOGRAM);
    setDefaultBarThickness(2, 0);
    setDefaultBarFgColor(Color.green, 0);
    setCursorLabelName("VMACDH", 0);
    addBand(0, PS_SOLID, 1, Color.darkgrey);
    askForInput();
    var x=0;
    fpArray[x] = new FunctionParameter("Short_period", FunctionParameter.NUMBER);
	with(fpArray[x++]){
        setName("Short Period");
        setLowerLimit(1);
        setUpperLimit(500);
        setDefault(12);
    }
    fpArray[x] = new FunctionParameter("Long_period", FunctionParameter.NUMBER);
	with(fpArray[x++]){
        setName("Long Period");
        setLowerLimit(1);
        setUpperLimit(501);
        setDefault(26);
    }
    fpArray[x] = new FunctionParameter("Smoothing_period", FunctionParameter.NUMBER);
	with(fpArray[x++]){
        setName("Smoothing Period");
        setLowerLimit(1);
        setUpperLimit(200);
        setDefault(9);
    }
}

var xVMACD = null;
var xVMACDSignal = null;

function main(Long_period, Short_period, Smoothing_period) {
var nBarState = getBarState();
var nRes = 0;
var nVMACD = 0;
var nVMACDSignal = 0;
    if (bVersion == null) bVersion = verify();
    if (bVersion == false) return;
    if (nBarState == BARSTATE_ALLBARS) {
        if (Long_period == null) Long_period = 26;
        if (Short_period == null) Short_period = 12;
        if (Smoothing_period == null) Smoothing_period = 9;
    }
    if (!bInit) {
        xVMACD =  efsInternal("Calc_VMACD", Long_period, Short_period);
        xVMACDSignal =  ema(Smoothing_period, xVMACD);
        bInit = true;
    }
    nVMACD = xVMACD.getValue(0);
    nVMACDSignal = xVMACDSignal.getValue(0);
    if (nVMACD == null || nVMACDSignal == null) return;
    nRes = nVMACD - nVMACDSignal;
    return nVMACD;
}

var bSecondInit = false;
var xLongMA = null;
var xShortMA = null;

function Calc_VMACD(Long_period, Short_period) {
var nRes = 0;
var nShortMA = 0;
var nLongMA = 0;
    if (!bSecondInit) {
        xLongMA = efsInternal("Calc_VWEMA", Long_period);
        xShortMA = efsInternal("Calc_VWEMA", Short_period);
        bSecondInit = true;
    }
    nLongMA = xLongMA.getValue(0);
    nShortMA = xShortMA.getValue(0);
    if (nLongMA == null || nShortMA == null) return;
    nRes = nShortMA - nLongMA;
    return nRes;
}

var bThridInit = false;
var xMAVolPrice = null;
var xMAVol = null;

function Calc_VWEMA(Length) {
var nRes = 0;
var nMAVolPrice = 0;
var nMAVol = 0;
    if (!bThridInit) {
        xMAVolPrice = ema(Length, efsInternal("CalcVolPrice"));
        xMAVol = ema(Length, volume());
        bThridInit = true;
    }
    nMAVolPrice = xMAVolPrice.getValue(0) * Length;
    nMAVol = xMAVol.getValue(0) * Length;
    if (nMAVolPrice == null || nMAVol == null || nMAVol == 0) return;
    nRes = nMAVolPrice / nMAVol;
    return nRes;
}

function CalcVolPrice() {
var nRes = 0;
    nRes = volume(0) * close(0);
    return nRes;
}

function verify() {
    var b = false;
    if (getBuildNumber() < 779) {
        drawTextAbsolute(5, 35, "This study requires version 8.0 or later.",
            Color.white, Color.blue, Text.RELATIVETOBOTTOM|Text.RELATIVETOLEFT|Text.BOLD|Text.LEFT,
            null, 13, "error");
        drawTextAbsolute(5, 20, "Click HERE to upgrade.@URL=https://www.esignal.com/download/default.asp",
            Color.white, Color.blue, Text.RELATIVETOBOTTOM|Text.RELATIVETOLEFT|Text.BOLD|Text.LEFT,
            null, 13, "upgrade");
        return b;
    } else {
        b = true;
    }
    return b;
}
To discuss this study or download complete copies of the formula code, please visit the Efs Library Discussion Board forum under the Forums link at www.esignalcentral.com or visit our Efs KnowledgeBase at www.esignalcentral.com/support/kb/efs/. The eSignal formula scripts (Efs) are also available for copying and pasting from the Stocks & Commodities website at Traders.com.
![]() WEALTH-LAB: VOLUME-WEIGHTED MACD HISTOGRAM
WEALTH-LAB: VOLUME-WEIGHTED MACD HISTOGRAM
We’ve added the Vmacdh indicator to the TascIndicator library to save you the trouble of typing in the few lines of code needed to recreate David Hawkins’ indicator, the volume-weighted Macd histogram, described in his article in this issue.
Our script is a study for Wealth-Lab 5 that demonstrates how to access and plot both the traditional and volume-weighted Macd histograms. It makes an attempt to quantify which Macd version sports the most frequent occurrences of “one-bar wonders” by tallying the indicator series that “turned up” on or just prior to a 10% trough bar. On the chart, this is indicated by the highlight in the Macd pane (frequently occurring for both indicators simultaneously). The total tallies are given in the upper-left corner. See Figure 3.
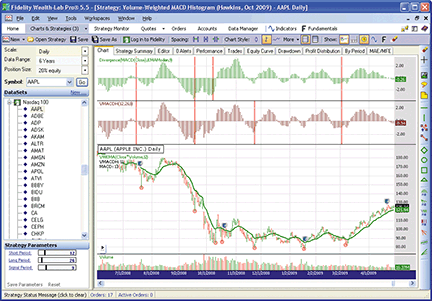
Figure 3: WEALTH-LAB, VMACDH Vs. traditional MACD. In our estimation, using VMACDH in this manner does not provide a statistically significant advantage over MACD.
WealthScript Code (C#):

/* Place the code within the namespace WealthLab.Strategies block; using TASCIndicators; */
public class MyStrategy : WealthScript
{
   StrategyParameter _short;
   StrategyParameter _long;
   StrategyParameter _sig;

   public MyStrategy()
   {
      _short = CreateParameter("Short Period", 12, 5, 50, 2);
      _long = CreateParameter("Long Period", 26, 20, 100, 2);
      _sig = CreateParameter("Signal Period", 9, 2, 40, 1);
   }

   protected override void Execute()
   {
      EMACalculation calc = EMACalculation.Modern;
      int sPer = _short.ValueInt;
      int lPer = _long.ValueInt;
      int sigPer = _sig.ValueInt;

      ChartPane vPane = CreatePane( 40, true, true );
      ChartPane mPane = CreatePane( 40, true, true );

      // VMACDH from the TASCIndicator library
      DataSeries vmacdh = VMACDH.Series(Bars, sPer, lPer, sigPer);
      PlotSeries( vPane, vmacdh, Color.Maroon, LineStyle.Histogram, 1);

      // Make the traditional MACD Histogram
      DataSeries hist = Divergence.Series(MACD.Series(Close), MAType.EMAModern, 9);
      PlotSeries( mPane, hist, Color.Green, LineStyle.Histogram, 1);

      // A volume-weighted ema is easy enough to create in 1 statement
      DataSeries vwema = EMA.Series(Close * Volume, sPer, calc) / EMA.Series(Volume, sPer, calc);
      vwema.Description = "VWEMA(Close*Volume," + sPer + ")";
      PlotSeries(PricePane, vwema, Color.Green, LineStyle.Solid, 2);

      /* Highlight and tally the version of MACD that had the most-recent TurnUp on or prior to the trough bar */
      int vwCount = 0;
      int maCount = 0;
      int bar = Bars.Count - 1;
      while( bar > 100 )
      {
         bar = (int)TroughBar.Series(Low, 10.0, PeakTroughMode.Percent)[bar];
         if( bar == -1 ) break;
         DrawCircle( PricePane, 8, bar, Low[bar], Color.Red, Color.FromArgb(70, Color.Red), LineStyle.Solid, 1, true );

         bool found = false;
         for (int n = bar; n > bar - 5; n--)
         {
            if( vmacdh[bar] < 0 && TurnUp(n, vmacdh) ) {
               SetPaneBackgroundColor(vPane, n, Color.LightCoral);
               vwCount++;
               found = true;
            }
            if( hist[bar] < 0 && TurnUp(n, hist) ) {
               SetPaneBackgroundColor(mPane, n, Color.LightCoral);
               maCount++;
               found = true;
            }
            if( found ) break;
         }
         bar--;
      }
      DrawLabel(PricePane, "VMACDH: " + vwCount);
      DrawLabel(PricePane, "MACD: " + maCount);
      PrintDebug(vwCount + "\t" + maCount);
   }
}
![]() AMIBROKER: VOLUME-WEIGHTED MACD HISTOGRAM
AMIBROKER: VOLUME-WEIGHTED MACD HISTOGRAM
In “Volume-Weighted Macd Histogram” in this issue, author David Hawkins presents an improved, volume-weighted version of the classic Macd histogram indicator.
Coding such an indicator is very straightforward. A ready-to-use AmiBroker formula for the indicator is presented in Listing 1. To use it, enter the formula in the Afl Editor, then select “Insert indicator.” The same formula can also be used in the Automatic Analysis feature to perform backtesting.
LISTING 1
PeriodS = Param("Short period", 12, 1, 500 );
PeriodL = Param("Long period", 26, 2, 501 );
PeriodSig = Param("Smoothing period", 9, 1, 200 );

LongMA = EMA( V * C, PeriodL ) / EMA( V, PeriodL );
ShortMA = EMA( V * C, PeriodS ) / EMA( V, PeriodS );

VMACD = ShortMA - LongMA;

SignalLine = EMA( VMACD, PeriodSig );

//Uncomment two lines below to see also MACD and signal line
//Plot( VMACD, "Vol-weighted MACD", colorRed );
//Plot( SignalLine, "Vol-weighted Signal", colorBlue );
Plot( VMACD-SignalLine, "VMACD Histogram", colorGreen, styleHistogram );
A sample chart is shown in Figure 4.
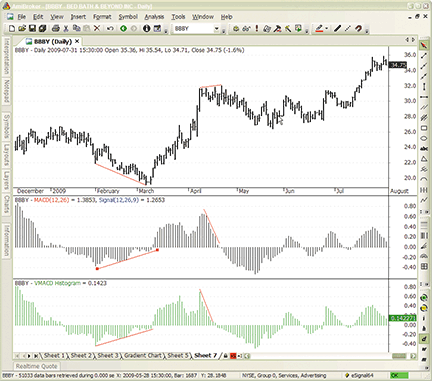
Figure 4: amibroker, VOLUME-WEIGHTED MACD HISTOGRAM VS. TRADITIONAL MACD HISTOGRAM. Here is a comparison of the traditional MACD histogram (black) and the volume-weighted MACD histogram (green). The topmost pane shows a daily chart of BBBY. In this example, the volume-weighted MACD responds sooner than the classic one.
![]() NEUROSHELL TRADER: VOLUME-WEIGHTED MACD HISTOGRAM
NEUROSHELL TRADER: VOLUME-WEIGHTED MACD HISTOGRAM
The volume-weighted exponential moving average (Vwema) and the volume-weighted Macd histogram (Vmacdh ) described by David Hawkins in his article in this issue can be easily implemented in NeuroShell Trader by combining a few of NeuroShell Trader’s 800+ indicators. To recreate the indicators, select “New Indicator…” from the Insert menu and use the Indicator Wizard to set up the following indicators (see Figure 5 for a sample):
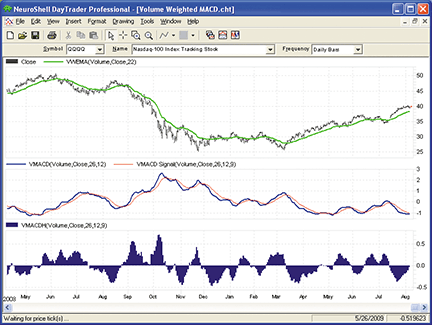
Figure 5: NEUROSHELL TRADER, Volume-Weighted MACD Histogram. Here is a sample NeuroShell Trader chart of the volume-weighted MACD histogram chart.
VWEMA:
Divide( ExpAvg( Multiply2( Volume, Close), 22 ), ExpAvg( Volume, 22 ) )

VMACD:
Subtract( Multiply2( 26, Divide( ExpAvg( Multiply2( Volume, Close), 26 ), ExpAvg( Volume, 26 )), Multiply2( 12, Divide( ExpAvg( Multiply2( Volume, Close), 12 ), ExpAvg( Volume, 12 )))

VMACD SIGNAL LINE:
ExpAvg ( VMACD, 9 )

VMACDH:
Subtract( VMACD, VMACD SIGNAL LINE )
![]() WORDEN BROTHERS’ STOCKFINDER: VOLUME-WEIGHTED MACD HISTOGRAM
WORDEN BROTHERS’ STOCKFINDER: VOLUME-WEIGHTED MACD HISTOGRAM
Note: To use the indicators, rules, and charts in this article, you will need the StockFinder software. Go to www.StockFinder.com to download the software and get a free trial.
The volume-weighted Macd histogram from David Hawkins’ article in this issue has been added to the StockFinder indicator library.
You can add the indicator to your chart in StockFinder by clicking the Add indicator button or by simply typing “/Macd” and choosing it from the filtered list of available indicators.
The indicator plots both the volume-weighted Macd with its trigger line and the histogram, which makes it easier to spot crossovers. We’ve added a condition-light column to the watchlist in Figure 6 so you can easily see the stocks where the histogram is crossing up through the zero line (Macd is crossing up through its trigger line).
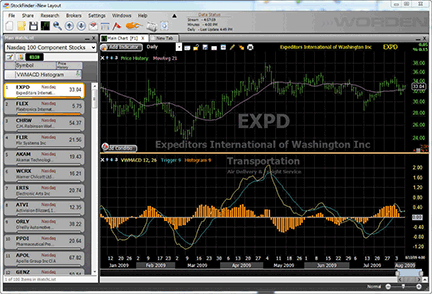
Figure 6: STOCKFINDER: Volume-Weighted MACD. Condition lights light up on stocks where the volume-weighted MACD histogram is crossing up through the zero line.
For more information or to start your free trial, visit www.StockFinder.com.
![]() AIQ: VOLUME-WEIGHTED MACD HISTOGRAM
AIQ: VOLUME-WEIGHTED MACD HISTOGRAM
The Aiq code is given here for the volume-weighted Macd presented in David Hawkins’ article in this issue, “Volume-Weighted Macd Histogram.”
The coded version that I have supplied also includes two systems that can be used to test the indicator. The first system only uses the standard Macd indicator and the second system uses the Vwmacd. The rules for the system are to go long when the Macd histogram peaks above zero and then declines for one bar, and exit when the indicator is above zero and then declines for one bar or after holding for 10 bars.
To test the indicator, I used three different lists of stocks: the S&P 100, the Nasdaq 100, and the Russell 1000 over the period 3/14/2003 to 8/11/2009. In the table in Figure 7, I show the comparative metrics of the long side using the standard and volume-weighted Macd indicators. In each test, the volume-weighted Macd metrics were somewhat better than the standard Macd.
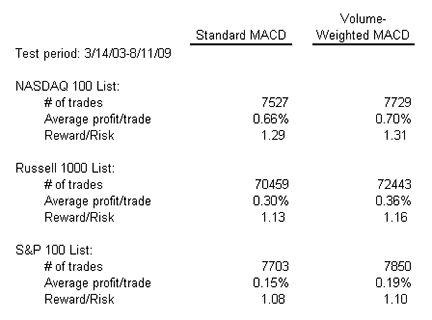
Figure 7: AIQ SYSTEMS, Standard vs. volume-weighted MACD histogram. This table shows the comparative metrics for the system using the standard and volume-weighted MACD histogram indicators.
The code can be downloaded from the Aiq website at www.aiqsystems.com and also from www.TradersEdgeSystems.com/traderstips.htm.
! VOLUME-WEIGHTED MACD (VWMACD)
! Author: David Hawkins, TASC October 2009
! Coded by: Richard Denning 8/9/09
! www.TradersEdgeSystems.com

! INPUTS:
macdLenS is 12.
macdLenL is 26.
macdLenSig is 9.

! ABBREVIATIONS:
C is [close].
V is [volume].
PD is {position days}.

! VARIABLES:
VWemaS is expavg(V*C,macdLenS) / expavg(V,macdLenS).
VWemaL is expavg(V*C,macdLenL) / expavg(V,macdLenL).
VWMACD is VWemaS - VWemaL.
! PLOT Line1 VWMACD
VWMACDsig is expavg(VWMACD,macdLenSig).
! PLOT Line2 VWMACDsig

! VWMACD HISTOGRAM:
VWMACDH is VWMACD - VWMACDsig.
! PLOT as VWMACD histogram

! STANDARD MACD:
emaS is expavg(C,macdLenS).
emaL is expavg(C,macdLenL).
MACD is emaS - emaL.
! PLOT Line1 MACD
MACDsig is expavg(MACD,macdLenSig).	! PLOT Line2 MACDsig

! VWMACD HISTOGRAM:
MACDH is MACD - MACDsig.
! PLOT as MACD histogram

! SYSTEM TO TEST INDICATORS:
BuyStdMACD if MACDH < 0 and MACDH > valresult(MACDH,1).
ExitStdMACD if (MACDH > 0 and MACDH < valresult(MACDH,1)) or PD >= 10.
BuyVWMACD if VWMACDH < 0 and VWMACDH > valresult(VWMACDH,1).
ExitVWMACD if (VWMACDH > 0 and VWMACDH < valresult(VWMACDH,1)) or PD >= 10.
![]() TRADERSSTUDIO: VOLUME-WEIGHTED MACD HISTOGRAM
TRADERSSTUDIO: VOLUME-WEIGHTED MACD HISTOGRAM
The TradersStudio code for the volume-weighted Macd from the article, “Volume-Weighted Macd Histogram” by David Hawkins, is shown here.
A comparison of the modified indicator and the standard Macd will be posted at the following websites for download together with the code:
TradersStudio website:
www.TradersStudio.com->Traders Resources->FreeCode
TradersEdgeSystems website:
www.TradersEdgeSystems.com/traderstips.htm.
' VOLUME-WEIGHTED EXPONENTIAL MOVING AVERAGE (VW_eMA)
' Author: David Hawkins, TASC October 2009
' Coded by: Richard Denning 8/9/09
' www.TradersEdgeSystems.com

Function VW_eMA(price As BarArray, maLen)
    Dim temp
    If V > 0 Then
        temp = XAverage(V*price,maLen) / XAverage(V,maLen)
    Else
        temp = Average(price,maLen)
    End If

    VW_eMA = temp
End Function
'-----------------------------------------------------------
' VOLUME-WEIGHTED MACD (VMACD)
' Author: David Hawkins, TASC October 2009
' Coded by: Richard Denning 8/9/09
' www.TradersEdgeSystems.com

Function VW_MACD(price As BarArray, maLenS, maLenL, maLenSig, ByRef VW_MACDsig As BarArray, ByRef VWMACDH)
  ' returns vol-wtg MACD as well as vol-wtg MACD signal line and the vol-wtg historigram
    Dim VW_eMAS
    Dim VW_eMAL
    Dim VW_eMASig
    Dim VMACD
    Dim VMACDsig

    VW_eMAS = VW_eMA(price,maLenS)
    VW_eMAL = VW_eMA(price,maLenL)
    VMACD = VW_eMAS - VW_eMAL
    VMACDsig = XAverage(VMACD,maLenSig)
    VWMACDH = VMACD - VMACDsig
    VW_MACD = VMACD
End Function
'-------------------------------------------------------------
' VOLUME-WEIGHTED EXPONENTIAL MACD HISTORIGRAM(VW_MACDH)
' Author: David Hawkins, TASC October 2009
' Coded by: Richard Denning 8/9/09
' www.TradersEdgeSystems.com

Function VW_MACDH(price As BarArray, maLenS, maLenL, maLenSig, ByRef VW_MACD, ByRef VW_MACDsig)
    Dim VW_eMAS
    Dim VW_eMAL
    Dim VW_eMASig
    Dim VMACD
    Dim VMACDsig
    Dim VMACDH

    VW_eMAS = VW_eMA(price,maLenS)
    VW_eMAL = VW_eMA(price,maLenL)
    VMACD = VW_eMAS - VW_eMAL
    VMACDsig = XAverage(VMACD,maLenSig)
    VMACDH = VMACD - VMACDsig

    VW_MACD = VMACD
    VW_MACDsig = VMACDsig
    VW_MACDH = VMACDH
End Function
'--------------------------------------------------------------
' VOLUME-WEIGHTED EXPONENTIAL MACD INDICATOR(VW_MACD)
' Author: David Hawkins, TASC October 2009
' Coded by: Richard Denning 8/9/09
' www.TradersEdgeSystems.com

Sub VW_MACD_IND(maLenS,maLenL,maLenSig)
    Dim VMACDH
    Dim VW_MACD
    Dim VW_MACDsig

    VMACDH = VW_MACDH(Input1, maLenS, maLenL, maLenSig, VW_MACD, VW_MACDsig)

    plot1(VW_MACD)
    plot2(VW_MACDsig)
    plot3(0)
End Sub
'-----------------------------------------------------------------
' VOLUME-WEIGHTED EXPONENTIAL MACD HISTORIGRAM(VW_MACDH)
' Author: David Hawkins, TASC October 2009
' Coded by: Richard Denning 8/9/09
' www.TradersEdgeSystems.com

Sub VW_MACDH_IND(maLenS,maLenL,maLenSig)
    Dim VMACDH
    Dim VW_MACD
    Dim VW_MACDsig

    VMACDH = VW_MACDH(Input1, maLenS, maLenL, maLenSig, VW_MACD, VW_MACDsig)
    plot1(VMACDH)
    plot2(0)
End Sub
'------------------------------------------------------------------
![]() STRATASEARCH: VOLUME-WEIGHTED MACD HISTOGRAM
STRATASEARCH: VOLUME-WEIGHTED MACD HISTOGRAM
Volume can be a helpful addition to an indicator, adding additional confirmation of price movements when volume is high, and minimizing the importance of those movements when volume is low. In “Volume-Weighted Macd Histogram” in this issue, author David Hawkins gives us a helpful method for adding this benefit to the Macd.
As Hawkins states, there are several ways to use the Macd. In our testing, the Vmacd did not provide significant benefit when using a zero-crossover approach. Holding periods were roughly one day shorter than with the traditional Macd, but this did not transfer to higher returns, perhaps because both winning and losing trades were shortened by one day.
However, using a divergence approach, the benefits of the Vmacd became more apparent (Figure 8). In particular, the average return for winning trades rose considerably, leading to significantly higher system returns than those of the traditional Macd. Thus, the use of the Vmacd can add benefit in some situations, and it can therefore be a helpful addition to the system trader’s toolbox.
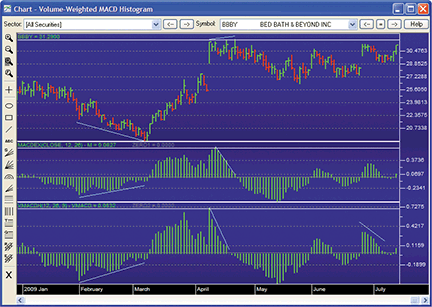
Figure 8: STRATASEARCH, Volume-Weighted MACD Histogram. The VMACD often provides a helpful one-day lead over the traditional MACD. In this chart, the MACD is shown in the middle panel and the VMACD is shown in the bottom panel. One-day leads can be seen in April and late June.
As with all other Traders’ Tips, additional information, including plug-ins, can be found in the Shared Area of the StrataSearch user forum. This month’s plug-in allows StrataSearch users to quickly run this indicator in an automated search, seeking out supplemental indicators that can turn the Vmacd into a complete trading system.
//*********************************************************
// Volume-Weighted MACD Histogram
//*********************************************************
PeriodS = parameter("Short Period");
PeriodL = parameter("Long Period");
PeriodSig = parameter("Smooth Period");
LongMA = (PeriodL * mov(V*C, PeriodL, E)) /
	(PeriodL * mov(V, PeriodL, E));
ShortMA = (PeriodS * mov(V*C, PeriodS, E)) /
	(PeriodS * mov(V, PeriodS, E));
VMACD = (ShortMA - LongMA);
SignalLine = mov(VMACD, PeriodSig, E);
VMACDH = VMACD-SignalLine;
![]() TRADINGSOLUTIONS: VOLUME-WEIGHTED MACD HISTOGRAM
TRADINGSOLUTIONS: VOLUME-WEIGHTED MACD HISTOGRAM
In his article “Volume-Weighted Macd Histogram” in this issue, David Hawkins combines the concepts of the volume-weighted moving average and the Macd histogram. The TradingSolutions function to implement this technique is described below and is also available as a file that can be downloaded from the TradingSolutions website (www.tradingsolutions.com) in the “Free Systems” section.
Function Name: Volume-Weighted Exponential Moving Average
Short Name: VWEMA
Inputs: Close, Volume, Period
Div (EMA (Mult (Volume, Close), Period), EMA (Volume, Period))

Function Name: Volume-Weighted MACD
Short Name: VWMACD
Inputs: Close, Volume, Short Period, Long Period
Sub (VWEMA (Close, Volume, Short Period), VWEMA (Close, Volume, Long Period))

Function Name: Volume-Weighted MACD Histogram
Short Name: VWMACDH
Inputs: Close, Volume, Short Period, Long Period, Smoothing Period
Sub (VWMACD (Close, Volume, Short Period, Long Period), EMA (VWMACD (Close, Volume, Short Period, Long Period), Smoothing Period))
![]() TRADECISION: VOLUME-WEIGHTED MACD HISTOGRAM
TRADECISION: VOLUME-WEIGHTED MACD HISTOGRAM
The article by David Hawkins in this issue, “Volume-Weighted Macd Histogram,” demonstrates how to make the Macd histogram (Macdh) perform better by volume-weighting it.
To implement the technique, use the Indicator Builder in Tradecision to set up the following indicators:
Volume-weighted moving average:
input
 Period:"Enter number of periods",52, 1, 500;
end_input

 var
 Per0:=Period;
 Vwma:= 0;
 end_var

 Vwma:= (CumSum(V * C, Per0) / CumSum(V, Per0));

 return Vwma;


Volume-weighted exponential moving average:
input
 Period:"Enter number of periods", 22, 1, 500;
end_input

 var
 Per0:=Period;
 Vwema:=0;
 end_var

 Vwema:=(Mov(V * C, Per0, E)) / (Mov(V, Per0, E));

 return Vwema;


Volume-weighted MACD histogram:
input
 PeriodS:"Enter short period", 12, 1, 500;  PeriodL:"Enter long  period", 26, 2, 501;  PeriodSig:"Enter smoothing period", 9, 1, 200;
end_input

 var
 PerS:=PeriodS;
 PerL:=PeriodL;
 PerSig:=PeriodSig;
 LongMA:=0;
 ShortMA:=0;
 VMACD:=0;
 SignalLine:=0;
 end_var

 LongMA:=(PerL * Mov(V * C, PerL, E)) / (PerL * Mov(V, PerL, E));  ShortMA:=(PerS * Mov(V * C, PerS, E)) / (PerS * Mov(V, PerS, E));  VMACD:=(ShortMA - LongMA);  SignalLine:=Mov(VMACD, PerSig, E);

return VMACD - SignalLine;
To import the strategy into Tradecision, visit the area “Traders’ Tips from TASC Magazine” at www.tradecision.com/support/tasc_tips/tasc_traders_tips.htm or copy the code from the Stocks & Commodities website at www.traders.com.
A sample chart is shown in Figure 9.
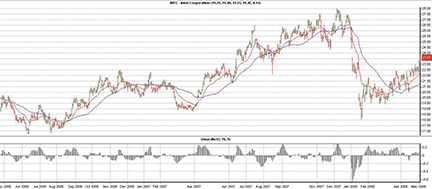
FIGURE 9: TRADECISION, VOLUME-WEIGHTED EMA VS. VOLUME-WEIGHTED MA. The VWEMA, VWMA, and volume-weighted MACD histogram are plotted on a daily chart of INTC for comparison.
![]() TRADE NAVIGATOR: VOLUME-WEIGHTED MACD HISTOGRAM
TRADE NAVIGATOR: VOLUME-WEIGHTED MACD HISTOGRAM
Trade Navigator offers everything needed for recreating the charts discussed in David Hawkins’ article in this issue, “Volume-Weighted Macd Histogram.”
Here, we will show you how to recreate the custom indicators, studies, and a template to easily add them to any chart in Trade Navigator.
You can recreate the custom indicators from the article with TradeSense code as follows: First, open the Trader’s Toolbox, click on the Functions tab, and click the New button. Type or copy-and-paste in the following code for the Vmacdh:
&LongMA := (PeriodL * MovingAvgX (Volume * Close , PeriodL)) / (PeriodL * MovingAvgX (Volume , PeriodL))
&ShortMA := (PeriodS * MovingAvgX (Volume * Close , PeriodS)) / (PeriodS * MovingAvgX (Volume , PeriodS))
&VMACD := (&ShortMA - &LongMA)
&Sigline := MovingAvgX (&VMACD , PeriodSig)

&VMACD - &Sigline
To create the function, click the Verify button. Click on the Add button for each of the three inputs. Go to the Inputs tab and set the value of PeriodL to 26, the value of PeriodS to 12, and the value of PeriodSig to 9. When you have finished, click the Save button, type a name for your new function, and click OK.
Repeat these steps for the Vwema and Vwma using the following formulas for each:
VWEMA:
MovingAvgX (Close * Volume , bars , False) / MovingAvgX (Volume , bars , False)
Add the input “bars” and set the input value for bars to 22.
VWMA:
MovingSum (Close * Volume , nbars) / MovingSum (Volume , nbars)
Add the input “nbars” and set the input value for nbars to 14.
To create a chart, go to the Add to Chart window by clicking on the chart and typing “A” on the keyboard. Click on the Indicators tab, find the MovingAvg indicator in the list, and either double-click on it or highlight the name and click the Add button. Repeat these steps to add MovingAvgX, Vwma, and Vwema. Once you have the four indicators added to the chart, click on the label for each indicator and drag it into the price pane.
Add the Vmacdh by following the same steps as above, but leave the Vmacdh in its own pane. Type “E” to bring up the Chart Settings window. Highlight the MovingAvg in the chart settings window and change bars used in average to 22. Next, highlight MovingAvgX and change the bars used in average to 22. Highlight the Vmacdh and set the “Type:” to histogram. (See Figure 10 for chart settings.) Highlight each indicator and change it to the desired color.
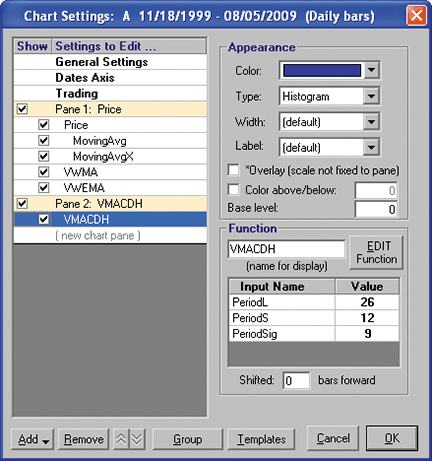
FIGURE 10: TRADE NAVIGATOR, chart settings
You can save each pane as a study by clicking on the pane name and clicking the Save Study button. Type a name for the study and click Save. When you have them the way you want to see them, click on the OK button.
You can save your new chart as a template to use for other charts. Once you have the chart set up, go to the Charts dropdown menu, select Templates and then Manage chart templates. Click on the New button, type in a name for your new template, and click OK.
Genesis Financial Technologies has provided a template including the custom indicators and studies discussed in this article as a special file named “SC0910,” downloadable through Trade Navigator.
![]() SWINGTRACKER: VOLUME-WEIGHTED MACD HISTOGRAM
SWINGTRACKER: VOLUME-WEIGHTED MACD HISTOGRAM
(For Windows, Mac, or Linux)
The Vmacdh indicator (volume-weighted Macd histogram) has been introduced in SwingTracker 5.15.101 based on David Hawkins’ article in this issue, “Volume-Weighted Macd Histogram.” A sample chart is shown in Figure 11. The chart parameters window is shown in Figure 12.
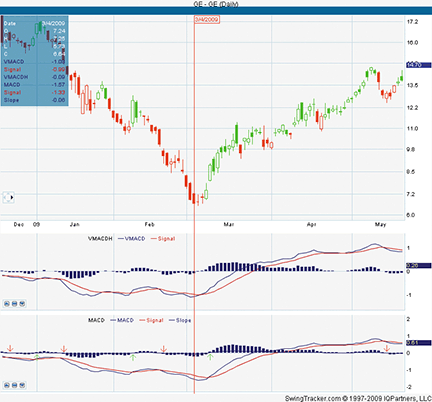
FIGURE 11: SWINGTRACKER, SAMPLE CHART OF VOLUME-WEIGHTED MACD HISTOGRAM
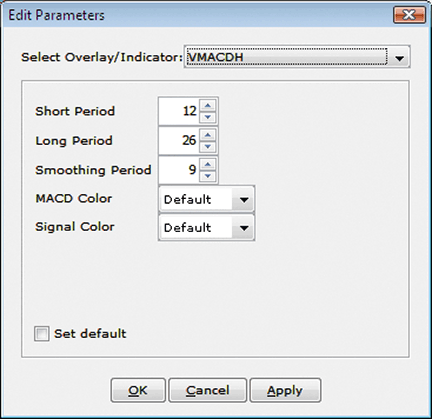
FIGURE 12: SWINGTRACKER, CHART PARAMETERS
To discuss these tools, please visit our forum at forum.mrswing.com. Our development staff can assist you at support.mrswing.com. For more information on our free trial, visit www.swingtracker.com.
![]() NEOTICKER: VOLUME-WEIGHTED MACD HISTOGRAM
NEOTICKER: VOLUME-WEIGHTED MACD HISTOGRAM
The volume-weighted Macd histogram can be recreated as a formula-language indicator in NeoTicker based on David Hawkins’ article, “Volume-Weighted Macd Histogram.”
The indicator named “Tasc volume weighted Macd” (Listing 1) has three parameters: short period, long period, and smoothing period, along with three plots: Vwmacd (volume-weighted Macd), signal line (smoothing line), and the Vwmacd histogram. This indicator will plot the volume-weighted Macd in a new pane and will show only the histogram by default (Figure 13). The other two plots can be shown by checking “Enable visual” in the indicator setup window.
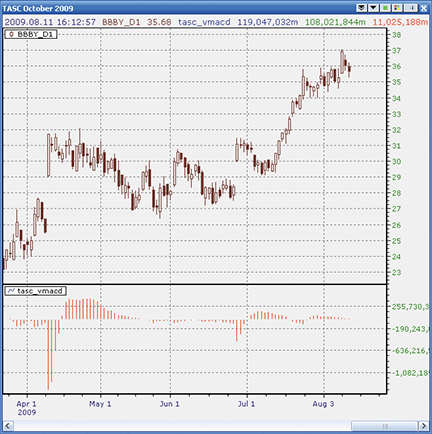
FIGURE 13: NEOTICKER, Vwmacd histogram
A downloadable version of the indicator will be available at the NeoTicker blog site (https://blog.neoticker.com).
Listing 1
$PeriodL := choose(param1 < 1, 1, param1 > 500, 500, param1);
$PeriodS := choose(param2 < 2, 2, param2 > 501, 501, param2);
$PeriodSig := choose(param3 < 1, 1, param3 > 200, 200, param3);
$LongMA  := $PeriodL*qc_xaverage(v*c, $PeriodL)/
            $PeriodL*qc_xaverage(v, $PeriodL);
$ShortMA := $PeriodS*qc_xaverage(v*c, $PeriodS)/
            $PeriodS*qc_xaverage(v, $PeriodS);
VWMACD := $ShortMA-$LongMA;
plot1 := VWMACD;
plot2 := qc_xaverage(VWMACD, $PeriodSig);
plot3 := plot1-plot2;
![]() UPDATA: VOLUME-WEIGHTED MACD HISTOGRAM
UPDATA: VOLUME-WEIGHTED MACD HISTOGRAM
This Traders’ Tip is based on “Volume-Weighted Macd Histogram” by David Hawkins. In his article, Hawkins constructs a volume-weighted exponential moving average and uses this to construct the Macd. He then imposes a non—volume-weighted exponential average signal line on the Macd to create the volume-weighted Macd histogram. Volume-weighting the exponential moving averages makes them respond more when volume is higher and less when its lower, which results in the Macdh becoming a better leading indicator.
The code to replicate the Macdh is simple. The Updata code shown here can also be found in the Updata Custom Indicator Library and may be downloaded by clicking the Custom menu and then “Custom Indicator Library.” Those who cannot access the library due to firewall issues may paste the following code into the Updata custom editor and save it.
' Volume-Weighted MACD Histogram by David Hawkins
' October 2009 issue of Stocks and Commodities Magazine
NAME Volume Weighted MACD Histogram
INDICATORTYPE CHART NEWWINDOW
DISPLAYSTYLE HISTOGRAM
PARAMETER "Period 1" #PERIOD1=12
PARAMETER "Period 2" #PERIOD2=26
PARAMETER "Signal Period" #PERIOD3=9
@WEIGHT=0
@AVE1=0
@AVE2=0
@VOLAVE1=0
@VOLAVE2=0
@VMACD=0
FOR #CURDATE=0 to #LASTDATE
   @WEIGHT=CLOSE*VOL
   @AVE1=SGNL(@WEIGHT,#PERIOD1,E)
   @AVE2=SGNL(@WEIGHT,#PERIOD2,E)
   @VOLAVE1=SGNL(VOL,#PERIOD1,E)
   @VOLAVE2=SGNL(VOL,#PERIOD2,E)
   IF @VOLAVE1>0 AND @VOLAVE2>0
      @VMACD=(@AVE1/@VOLAVE1)-(@AVE2/@VOLAVE2)
      @PLOT=@VMACD-SGNL(@VMACD,#PERIOD3,E)
   ENDIF
NEXT
See Figure 14 for a sample chart.
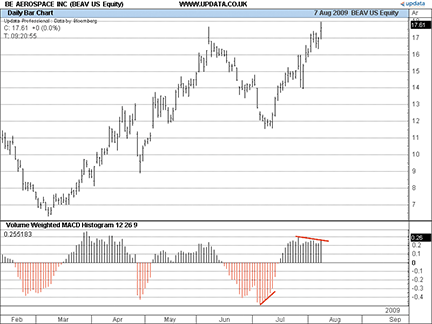
Figure 14: UPDATA. This sample chart shows what BE Aerospace has done in the days or weeks since Hawkins’ article leaves off. The July divergence he points out has resulted in a big move. There is now bearish divergence between the August highs and the MACDH.
![]() NINJATRADER: VOLUME-WEIGHTED MACD HISTOGRAM
NINJATRADER: VOLUME-WEIGHTED MACD HISTOGRAM
The volume-weighted Macd histogram discussed in David Hawkins’ article in this issue (“Volume-Weighted Macd Histogram”) has been implemented as a sample indicator available for download at www.ninjatrader.com/SC/October2009SC.zip.
Once it has been downloaded, from within the NinjaTrader Control Center window, select the menu File > Utilities > Import NinjaScript and select the downloaded file. This indicator is for NinjaTrader version 6.5 or greater.
You can review the indicator’s source code by selecting the menu Tools > Edit NinjaScript > Indicator from within the NinjaTrader Control Center window and selecting “VwemacdHistogram.”
NinjaScript indicators are compiled Dlls that run native, not interpreted, which provides you with the highest performance possible.
A sample chart is shown in Figure 15.
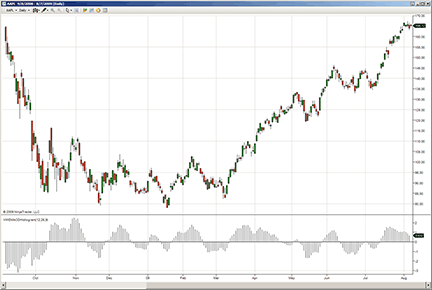
Figure 15: NINJATRADER, volume-weighted MACD histogram. This screenshot shows the volume-weighted MACD histogram indicator running on a daily chart of AAPL.
![]() WAVE59: VOLUME-WEIGHTED MACD HISTOGRAM
WAVE59: VOLUME-WEIGHTED MACD HISTOGRAM
In his article “Volume-WeightedMacd Histogram” in this issue, David Hawkins implements a volume-weighted moving average in calculating the popular Macd technical study, improving its sensitivity and reducing lag.
Figure 16 is a weekly chart of Aapl with Hawkins’ study applied. Notice the divergence at the December 2008 lows, signaling a move to the upside. More important, notice the bearish divergence that has been forming since May, suggesting that Aapl’s strong upward move may soon lose some steam.
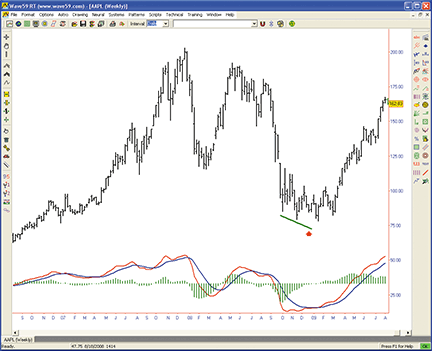
figure 16: WAVE59, volume-weighted MACD histogram. Showing the volume-weighted MACD histogram indicator running on a weekly chart of AAPL.
The following script implements this indicator in Wave59. As always, users of Wave59 can download these scripts directly using the QScript Library found at https://www.wave59.com/library.
Indicator:  SC_Hawkins_VMACD
input: short(12), long(26), smooth(9), raw_color(red),
  smooth_color(blue), histogram_color(green), thickness(1),
  show_lines(true), show_histogram(true);

# calculate long average
long1 = xaverage(volume*close, long);
long2 = xaverage(volume, long);
if (long2 != 0)
   longma = long1/long2;

#calculate short average
short1 = xaverage(volume*close, short);
short2 = xaverage(volume, short);
if (short2 ! =  0)
   shortma = short1/short2;

#calculate macd lines
vmacd = shortma - longma;
signalline = xaverage(vmacd, smooth);

#plot everything
if (show_lines) {
    plot1 = vmacd;
    color1 = raw_color;
    plot2 = signalline;
    color2 = smooth_color;
    thickness1, thickness2 = thickness;
}
if (show_histogram) {
    plot3 = vmacd - signalline;
    color3 = histogram_color;
    style3 = ps_histogram;
    thickness3 = thickness;
}
--------------------------------------------
![]() VT TRADER: VOLUME-WEIGHTED MACD HISTOGRAM
VT TRADER: VOLUME-WEIGHTED MACD HISTOGRAM
Our Traders’ Tip this month is inspired by the article “Volume-Weighted Macd Histogram” by David Hawkins in this issue. We’ll be offering the Vwmacd histogram indicator for download in our online forums. The VT Trader code and instructions for recreating the indicator are as follows:
- VT Trader’s Ribbon>Technical Analysis menu> Indicators group>Indicators Builder>[New] button
- In the Indicator Bookmark, type the following text for each field:
Name: TASC - 10/2009 - Volume-Weighted MACD Histogram Short Name: tasc_VWMACD Label Mask: TASC - 10/2009 - Volume-Weighted MACD Histogram (%ShortPeriods%,%LongPeriods%,%SignalPeriods%) = %VWMACD% Placement: New Frame Inspect Alias: VWMACD - In the Input Variable(s) tab, create the following variables:
[New] button... Name: ShortPeriods Display Name: Short MA Periods Type: integer Default: 12 [New] button... Name: LongPeriods Display Name: Long MA Periods Type: integer Default: 26 [New] button... Name: SignalPeriods Display Name: Signal MA Periods Type: integer Default: 9 - In the Output Variable(s) tab, create the following variables:
[New] button... Var Name: VWMACD Name: (VWMACD) Line Color: dark green Line Width: slightly thicker Line Type: histogram - In the Horizontal Line tab, create the following variables:
[New] button... Value: +0.0000 Color: black Width: thin Type: dashed - In the Formula tab, copy and paste the following formula:
{Provided By: Capital Market Services, LLC & Visual Trading Systems, LLC} {Copyright: 2009} {Description: TASC, October 2009 - "Improving the Lead, The Volume-Weighted MACD Histogram" by David Hawkins} {File: tasc_VWMACD.vtsrc - Version 1.0} ShortMA:= (ShortPeriods*mov(V*C,ShortPeriods,E))/(ShortPeriods*mov(V,ShortPeriods,E)); LongMA:= (LongPeriods*mov(V*C,LongPeriods,E))/(LongPeriods*mov(V,LongPeriods,E)); VMACD:= ShortMA-LongMA; SignalLine:= mov(VMACD,SignalPeriods,E); VWMACD:= VMACD-SignalLine; - Click the “Save” icon to finish building the Vwmacd histogram.
To attach the indicator to a chart, click the right mouse button within the chart window and then select “Add Indicator” > “Tasc - 10/2009 - Volume-Weighted Macd Histogram” from the indicator list. See Figure 17.
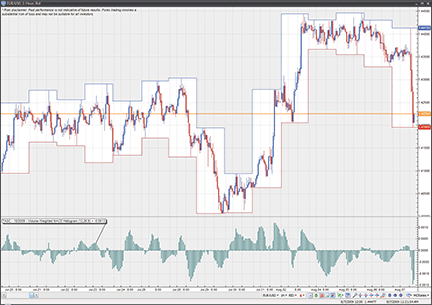
Figure 17: VT TRADER. Here is the VWMACD histogram attached to a EUR/USD one-hour candle chart.
Risk disclaimer: Past performance is not indicative of future results. Forex trading involves a substantial risk of loss and may not be suitable for all investors.
![]() TRADE IDEAS: VOLUME-WEIGHTED MACD HISTOGRAM
TRADE IDEAS: VOLUME-WEIGHTED MACD HISTOGRAM
“It’s all about maximizing the frosting:cupcake ratio.” —Steven Place, professional options trader, StockTwits Network contributor
This month’s Traders’ Tip is based on “Volume-Weighted Macd Histogram” by David Hawkins in this issue. Our model this month shares the same goal as Hawkins — how best to incorporate volume into a moving average indicator. We also assign the most weight in our calculations to the most recent results — in our case, even in real time.
While modeling our strategy, we discovered an interesting pattern based on finding Macd tops. We liked the results as reported by our event-based backtesting tool, The OddsMaker, so much that we present the strategy, the backtest, and all the settings here.
Description: “MACD Tops”
Provided by:
Trade Ideas (copyright © Trade Ideas LLC 2009). All rights reserved. For educational purposes only.
Remember these are sketches meant to give an idea how to model a trading plan. Trade-Ideas.com and
all individuals affiliated with this site assume no responsibilities for trading and investment results.
Type or copy/paste this shortened string directly into a browser, then copy/paste the full-length link into Trade-Ideas Pro using the “Collaborate” feature (right-click in any strategy window):
https://bit.ly/smiFw (case-sensitive)
This strategy also appears on the Trade Ideas blog at https://marketmovers.blogspot.com/, or you can build the strategy from Figure 18, which shows the configuration of this strategy, where one alert and four filters are used with the following settings:
- 20-period SMA crossed above the 200-period SMA (two-minute) alert
- Min price = 5 ($)
- Max price = 100 ($)
- Min daily volume = 500,000 (shares/day)
- Min current volume = 5 (ratio)
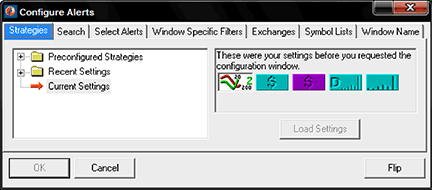
Figure 18: TRADE IDEAS, ALERTS CONFIGURATION
The definitions of these indicators appear here: https://www.trade-ideas.com/Help.html.
That’s the strategy, but what about the trading rules? How should the opportunities that the strategy finds be traded?
To recap briefly, The OddsMaker doesn’t just look at a basket of stocks, à priori, to generate backtest results. Rather, it considers any stock that matched a desired pattern in the market, finds that stock, and applies the backtest’s rule set before summing up the results into a detailed set of totals: win rate, average winner, average loser, net winnings, and confidence factor (Figure 20).
In summary, this strategy trades the entire day of the market, buying when the 20-period Sma crosses above the 200-period Sma (two-minute) signals. We evaluated several time frames, but were ultimately led to a hold time lasting until the open after a five-day hold time with no stop value assigned or predetermined profit target. You may decide conservatively and based on The OddsMaker average loss results (see Figure 20) that a $0.60 stop is necessary.
Here is what The OddsMaker tested for the past 30 days ended 8/3/2009 given the following trade rules:
- On each alert, buy (long) the symbol (price moves up to be a successful trade)
- Schedule an exit for the stocks at the open after five days
- Trade the entire market session.
The OddsMaker summary provides the evidence of how well this strategy and our trading rules did. The settings are shown in Figure 19.
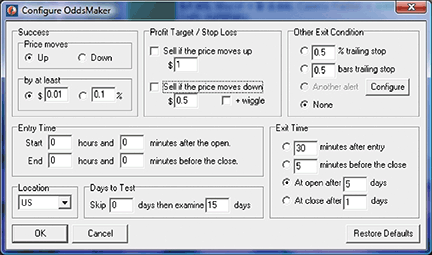
FIGURE 19: TRADE IDEAS, ODDSMAKER BACKTESTING CONFIGURATION
The results (last backtested for the 15-day period ended 8/3/2009) are shown in Figure 20. The summary reads as follows: This strategy generated 141 trades of which 100 were profitable for a win rate of 71%. The average winning trade generated $1.61 in profit and the average loser lost $0.60. That’s more than a 2:1 win-to-loss ratio. The net winnings of using this strategy for 15 trading days generated $137.14 points. If you normally trade in 100-share lots, this strategy would have generated $13,714. The z-score or confidence factor that the next set of results will fall within this strategy’s average winner and loser is 100%.
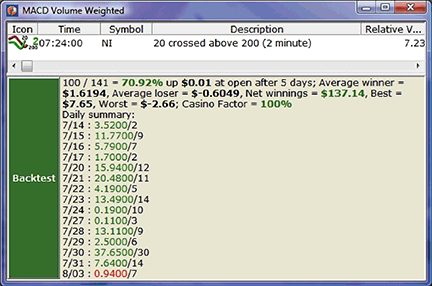
FIGURE 20: TRADE IDEAS, BACKTEST RESULTS
Learn more about these backtest results from The OddsMaker by going to the online user’s manual at https://www.trade-ideas.com/OddsMaker/Help.html. If you are interested in more volume-weighted alerts, you can read about volume-weighted average price (Vwap) here: https://www.trade-ideas.com/Help.html#CAVC.
![]() METASTOCK: VOLUME-WEIGHTED MACD HISTOGRAM (Hawkins Article Code)
METASTOCK: VOLUME-WEIGHTED MACD HISTOGRAM (Hawkins Article Code)
Here is the MetaStock code to implement the volume-weighted Macd histogram from David Hawkins’ article in this issue, “Volume-Weighted Macd Histogram.”
PeriodS:=Input(“Enter short period”,1,500,12);
PeriodL:=Input(“Enter long period”,2,501,26);
PeriodSig:=Input(“Enter smoothing period”,1,200,9);
LongMA:=(PeriodL*Mov(V*C,PeriodL,E))/
(PeriodL*Mov(V,PeriodL,E));
ShortMA:=(PeriodS*Mov(V*C,PeriodS,E))/
(PeriodS*Mov(V,PeriodS,E));
VMACD:=(ShortMA-LongMA);
SignalLine:=Mov(VMACD,PeriodSig,E);
VMACD-SignalLine