TRADERS’ TIPS
August 2010
Here is this month’s selection of Traders’ Tips, contributed by various developers of technical analysis software to help readers more easily implement some of the strategies presented in this and other issues.
Other code appearing in articles in this issue is posted in the Subscriber Area of our website at https://technical.traders.com/sub/sublogin.asp. Login requires your last name and subscription number (from mailing label). Once logged in, scroll down to beneath the “Optimized trading systems” area until you see “Code from articles.” From there, code can be copied and pasted into the appropriate technical analysis program so that no retyping of code is required for subscribers.
You can copy these formulas and programs for easy use in your spreadsheet or analysis software. Simply “select” the desired text by highlighting as you would in any word processing program, then use your standard key command for copy or choose “copy” from the browser menu. The copied text can then be “pasted” into any open spreadsheet or other software by selecting an insertion point and executing a paste command. By toggling back and forth between an application window and the open web page, data can be transferred with ease.
This month’s tips include formulas and programs for:
- TRADESTATION: NORMALIZED VOLATILITY INDICATOR
- eSIGNAL: NORMALIZED VOLATILITY INDICATOR
- METASTOCK: NORMALIZED VOLATILITY INDICATOR
- WEALTH-LAB: NORMALIZED VOLATILITY INDICATOR
- AMIBROKER: NORMALIZED VOLATILITY INDICATOR
- NEUROSHELL TRADER: NORMALIZED VOLATILITY INDICATOR
- WORDEN BROTHERS STOCKFINDER: NORMALIZED VOLATILITY INDICATOR
- AIQ: NORMALIZED VOLATILITY INDICATOR
- TRADERSSTUDIO: NORMALIZED VOLATILITY INDICATOR
- TRADECISION: NORMALIZED VOLATILITY INDICATOR
- NINJATRADER: NORMALIZED VOLATILITY INDICATOR
- WAVE59: NORMALIZED VOLATILITY INDICATOR
- UPDATA: NORMALIZED VOLATILITY INDICATOR
- CHARTSY: NORMALIZED VOLATILITY INDICATOR
- TRADESIGNAL: NORMALIZED VOLATILITY INDICATOR
- TRADING BLOX: NORMALIZED VOLATILITY INDICATOR
- VT TRADER: NORMALIZED VOLATILITY INDICATOR
- PROREALTIME: NORMALIZED VOLATILITY INDICATOR — ARTICLE CODE
![]() TRADESTATION: NORMALIZED VOLATILITY INDICATOR
TRADESTATION: NORMALIZED VOLATILITY INDICATOR
Rajesh Kayakkal’s article in this issue, “Normalized Volatility Indicator,” proposes ways to use a volatility measure based on an average true range calculation. His strategy involves establishing trend by comparing the normalized volatility indicator (Nvi) to a constant threshold value. If the Nvi is above the threshold value, the strategy closes any long positions and sells short every day until the Nvi crosses below the threshold value. If the Nvi is below the threshold, the strategy closes any short positions and buys every day until the Nvi crosses above the threshold value.
Two indicators and two strategies were coded for this project. The Kayakkal_NVI plots the Nvi value and two moving averages of the Nvi value. The Kayakkal_Position indicator plots the number of shares/contracts in the current position. The Kayakkal_NVIStrategy tests the basic system. The Kayakkal_NVIStratAvg is similar to the basic system, with a filter to enter long positions only if price is above a 200-day exponential moving average (Ema) of the close, and to enter short positions only if price is below a 200-day Ema of the close.
To download the EasyLanguage code, go to the TradeStation and EasyLanguage Support Forum (https://www.tradestation.com/Discussions/forum.aspx?Forum_ID=213). Search for the file “Kayakkal_NVI.eld.”
A sample chart is shown in Figure 1.
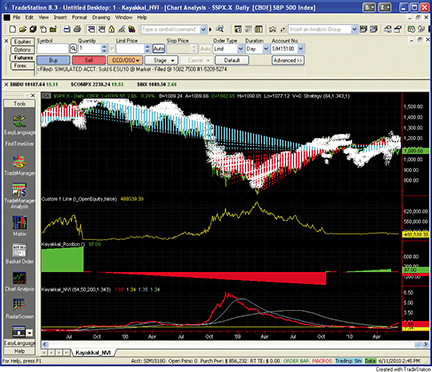
Figure 1: TRADESTATION, Normalized Volatility Indicator. Here is a sample chart of the daily S&P 500. The upper pane contains a price chart overlaid with backtested Kayakkal_NVIStrategy trades. The second pane uses the indicator “Custom 1 Line” to display the strategy’s cumulative profit/loss (without commissions and slippage). The third pane uses Kayakkal_Position to display how the position changes over time. The fourth pane plots the Kayakkal NVI value along with two moving averages of the NVI.
This article is for informational purposes. No type of trading or investment recommendation, advice, or strategy is being made, given, or in any manner provided by TradeStation Securities or its affiliates.
Indicator: Kayakkal_NVI
inputs:
	ATR_Range( 64 ),
	ShortAvgLength( 50 ),
	LongAvgLength( 200 ),
	PivotLine( 1.343 ) ;

variables:
	NVI( 0 ) ;

NVI = AvgTrueRange( ATR_Range ) / Close * 100 ;

Plot1( NVI, "NVI" ) ;
Plot2( PivotLine, "Pivot" ) ;
Plot3( AverageFC( NVI, ShortAvgLength ), "ShortAvg" ) ;
Plot4( AverageFC( NVI, LongAvgLength ), "LongAvg" ) ;

Indicator: Kayakkal_Position
if I_MarketPosition > 0 then
	Plot1( I_CurrentShares , "Long" )
else if I_MarketPosition < 0 then
	Plot2( I_CurrentShares * -1 , "Short" ) ;

Strategy: Kayakkal_NVIStrategy
inputs:
	ATR_Range( 64 ),
	NVI_Threshold( 1.343 ),
	Quantity( 1 ) ;

variables:
	NVI( 0 );

NVI = AvgTrueRange( ATR_Range ) / Close * 100 ;

if NVI > NVI_Threshold  then
	SellShort Quantity contracts next bar at market
else if NVI < NVI_Threshold then
	Buy Quantity contracts next bar at market ;

Strategy: Kayakkal_NVIStratAvg
inputs:
	ATR_Range( 64 ),
	NVI_Threshold( 1.343 ),
	AverageLength( 200 ),
	Quantity( 1 ) ;

variables:
	NVI( 0 ) ;

NVI = AvgTrueRange( ATR_Range ) / Close * 100 ;

if NVI < NVI_Threshold and
	Close < XAverage( Close, AverageLength ) then
	SellShort Quantity contracts next bar at market ;

if NVI > NVI_Threshold and
	Close > XAverage( Close, AverageLength )then
	Buy Quantity contracts next bar at market ;
![]() eSIGNAL: NORMALIZED VOLATILITY INDICATOR
eSIGNAL: NORMALIZED VOLATILITY INDICATOR
For this month’s Traders’ Tip, we’ve provided two formulas, “Kayakkal_NVI.efs” and “Kayakkal_NVI_Strategy.efs,” based on the formula code given in Rajesh Kayakkal’s article in this issue, “Normalized Volatility Indicator.”
The studies contain formula parameters to set the Length and X parameters, which may be configured through the Edit Studies window (Advanced Chart menu → Edit Studies). The Kayakkal_NVI.efs study simply plots the Nvi. The Kayakkal_NVI_Strategy formula is configured for backtesting and contains one additional formula parameter for the strategy Lot Size.
A sample chart is shown in Figure 2.
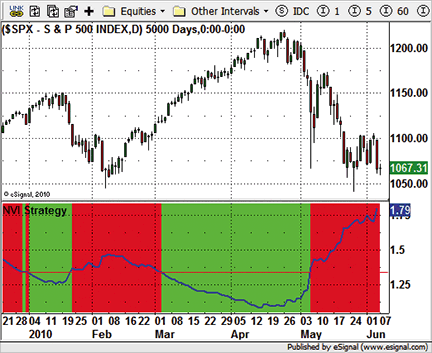
Figure 2: eSIGNAL, Normalized Volatility Indicator
Kayakkal_NVI.efs

/*********************************
Provided By:
eSignal (Copyright c eSignal), a division of Interactive Data
Corporation. 2010. All rights reserved. This sample eSignal
Formula Script (EFS) is for educational purposes only and
may be modified and saved under a new file name. eSignal
is not responsible for the functionality once modified. eSignal
reserves the right to modify and overwrite this EFS file with
each new release.

Description:
    Normalized volatility indicator

Version:            1.00  06/07/2010

Formula Parameters:                     Default:

Notes:
    The related article is copyrighted material. If you are not a
    subscriber of Stocks & Commodities, please visit www.traders.com.

**********************************/
var fpArray = new Array();
var bInit = false;
var bVersion = null;

function preMain() {
    setPriceStudy(false);
    setShowCursorLabel(true);
    setShowTitleParameters(false);
    setStudyTitle("NVI");
    setCursorLabelName("NVI", 0);
    setDefaultBarFgColor(Color.blue, 0);
    setPlotType(PLOTTYPE_LINE, 0);
    setDefaultBarThickness(2, 0);
    var x=0;
    fpArray[x] = new FunctionParameter("Length", FunctionParameter.NUMBER);
	with(fpArray[x++]){
        setName("Length");
        setLowerLimit(1);
        setDefault(64);
    }
    fpArray[x] = new FunctionParameter("X", FunctionParameter.NUMBER);
	with(fpArray[x++]){
        setName("X");
        setDefault(1);
    }
}

var xNVI = null;

function main(Length, X) {
var nBarState = getBarState();
var nNVI = 0;
    if (bVersion == null) bVersion = verify();
    if (bVersion == false) return;
    if (nBarState == BARSTATE_ALLBARS) {
        if (Length == null) Length = 64;
        if (X == null) X = 1;
    }
    if (!bInit) {
        xNVI = efsInternal("Calc_NVI", Length);
        addBand(0, PS_SOLID, 1, Color.lightgrey, "Zero");
        addBand(X, PS_SOLID, 1, Color.red, "X");
        bInit = true;
    }
    nNVI = xNVI.getValue(0);
    if (nNVI == null) return;
    return nNVI;
}

var bSecondInit = false;
var xClose = null;
var xATR = null;

function Calc_NVI(Length) {
var nRes = 0;
var nClose = 0;
var nATR = 0;
    if (!bSecondInit) {
        xClose = close();
        xATR = atr(Length);
        bSecondInit = true;
    }
    nClose = xClose.getValue(0);
    nATR = xATR.getValue(0);
    if (nATR == null) return;
    nRes = nATR / nClose * 100;
    return nRes;
}

function verify() {
    var b = false;
    if (getBuildNumber() < 779) {
        drawTextAbsolute(5, 35, "This study requires version 8.0 or later.",
            Color.white, Color.blue, Text.RELATIVETOBOTTOM|Text.RELATIVETOLEFT|Text.BOLD|Text.LEFT,
            null, 13, "error");
        drawTextAbsolute(5, 20, "Click HERE to upgrade.@URL=https://www.esignal.com/download/default.asp",
            Color.white, Color.blue, Text.RELATIVETOBOTTOM|Text.RELATIVETOLEFT|Text.BOLD|Text.LEFT,
            null, 13, "upgrade");
        return b;
    } else {
        b = true;
    }
    return b;
}


Kayakkal_NVI_Strategy.efs

/*********************************
Provided By:
eSignal (Copyright c eSignal), a division of Interactive Data
Corporation. 2010. All rights reserved. This sample eSignal
Formula Script (EFS) is for educational purposes only and
may be modified and saved under a new file name. eSignal
is not responsible for the functionality once modified. eSignal
reserves the right to modify and overwrite this EFS file with
each new release.

Description:
    Normalized volatility indicator  Strategy

Version:            1.00  06/07/2010

Formula Parameters:                     Default:

Notes:
    The related article is copyrighted material. If you are not a
    subscriber of Stocks & Commodities, please visit www.traders.com.
**********************************/
var fpArray = new Array();
var bInit = false;
var bVersion = null;

function preMain() {
    setPriceStudy(false);
    setShowCursorLabel(true);
    setShowTitleParameters(false);
    setStudyTitle("NVI Strategy");
    setCursorLabelName("NVI", 0);
    setDefaultBarFgColor(Color.blue, 0);
    setPlotType(PLOTTYPE_LINE, 0);
    setDefaultBarThickness(2, 0);
    var x=0;
    fpArray[x] = new FunctionParameter("Length", FunctionParameter.NUMBER);
	with(fpArray[x++]){
        setName("Length");
        setLowerLimit(1);
        setDefault(64);
    }
    fpArray[x] = new FunctionParameter("X", FunctionParameter.NUMBER);
	with(fpArray[x++]){
        setName("X");
        setDefault(1);
    }
    fpArray[x] = new FunctionParameter("LotSize", FunctionParameter.NUMBER);
	with(fpArray[x++]){
        setName("Lot Size");
        setDefault(1);
    }
}

var xNVI = null;

function main(Length, X, LotSize) {
var nBarState = getBarState();
var nNVI = 0;
    if (bVersion == null) bVersion = verify();
    if (bVersion == false) return;
    if (getCurrentBarIndex() == 0) return;
    if (nBarState == BARSTATE_ALLBARS) {
        if (Length == null) Length = 64;
        if (X == null) X = 1;
        if (LotSize == null) LotSize = 1;
    }
    if (!bInit) {
        xNVI = efsInternal("Calc_NVI", Length);
        addBand(0, PS_SOLID, 1, Color.lightgrey, "Zero");
        addBand(X, PS_SOLID, 1, Color.red, "X");
        bInit = true;
    }
    nNVI = xNVI.getValue(0);
    if (nNVI == null) return;
    if (nNVI < X) {
        if (Strategy.isShort()) {
            Strategy.doCover("Exit Short", Strategy.MARKET, Strategy.NEXTBAR, Strategy.ALL);
        }
        Strategy.doLong("Long", Strategy.MARKET, Strategy.NEXTBAR, LotSize);
    }
    if (nNVI > X) {
        if (Strategy.isLong()) {
            Strategy.doSell("Exit Long", Strategy.MARKET, Strategy.NEXTBAR, Strategy.ALL);
        }
        Strategy.doShort("Short", Strategy.MARKET, Strategy.NEXTBAR, LotSize);
    }
  	if(Strategy.isLong()) {
        setBarBgColor(Color.lime, 0, 0, 10);
    } else {
        if(Strategy.isShort()) {
            setBarBgColor(Color.red, 0, 0, 10);
        } else {
            setBarBgColor(Color.white, 0, 0, 10);
        }
    }
    return nNVI;
}

var bSecondInit = false;
var xClose = null;
var xATR = null;

function Calc_NVI(Length) {
var nRes = 0;
var nClose = 0;
var nATR = 0;
    if (!bSecondInit) {
        xClose = close();
        xATR = atr(Length);
        bSecondInit = true;
    }
    nClose = xClose.getValue(0);
    nATR = xATR.getValue(0);
    if (nATR == null) return;
    nRes = nATR / nClose * 100;
    return nRes;
}

function verify() {
    var b = false;
    if (getBuildNumber() < 779) {
        drawTextAbsolute(5, 35, "This study requires version 8.0 or later.",
            Color.white, Color.blue, Text.RELATIVETOBOTTOM|Text.RELATIVETOLEFT|Text.BOLD|Text.LEFT,
            null, 13, "error");
        drawTextAbsolute(5, 20, "Click HERE to upgrade.@URL=https://www.esignal.com/download/default.asp",
            Color.white, Color.blue, Text.RELATIVETOBOTTOM|Text.RELATIVETOLEFT|Text.BOLD|Text.LEFT,
            null, 13, "upgrade");
        return b;
    } else {
        b = true;
    }
    return b;
}
To discuss this study or download complete copies of the formula code, please visit the Efs Library Discussion Board forum under the Forums link at www.esignalcentral.com or visit our Efs KnowledgeBase at www.esignalcentral.com/support/kb/efs/. The eSignal formula scripts (Efs) are also available for copying and pasting from the Stocks & Commodities website at Traders.com.
![]() METASTOCK: NORMALIZED VOLATILITY INDICATOR
METASTOCK: NORMALIZED VOLATILITY INDICATOR
Rajesh Kayakkal’s indicator named the normalized volatility indicator, described in his article of the same name elsewhere in this issue, can be added to MetaStock using the following steps:
- In the Tools menu, select Indicator Builder.
- Click New to open the Indicator Editor for a new indicator.
- Type the name “Bandpass.”
- Click in the larger window and paste or type in the following formula:
(ATR(64)/C)*100
- Click OK to close the Indicator Editor.
- Click OK to close Indicator Builder.
These steps create a system test to find the optimal threshold for the Nvi for different indexes:
- Select Tools → the Enhanced System Tester.
- Click New.
- Enter the name, “NVI System”
- Select the Buy Order tab and enter the following formula:
nvi:=(ATR(64)/C)*100;
nvi<opt1 AND C>Mov(C,200,S)
- Select the Sell Short Order tab and enter the following formula:
nvi:=(ATR(64)/C)*100;
nvi>opt1 AND C<Mov(C,200,S)
- Click the Optimization tab.
- Highlight OPT1 and click Edit.
- Type in “NVI Threshold” for the description.
- Set the Minimum value to 1
- Set the Maximum value to 1.5
- Set the Step to 0.001
- Click OK to close the system editor.
![]() WEALTH-LAB: NORMALIZED VOLATILITY INDICATOR
WEALTH-LAB: NORMALIZED VOLATILITY INDICATOR
The normalized volatility indicator presented in Rajesh Kayakkal’s article in this issue by the same name can be found in Wealth-Lab’s Standard Indicators set as “Atrp.”
Using some artistic license with the strategy, I used an Ema-smoothed version of Atrp to avoid whipsaw trades around the trigger level. By detecting the next market structure peak (short) or trough (long) and then comparing current price to the previous position’s entry price before adding a new position, the WealthScript strategy adds positions (a fixed-dollar value) only when the market continues to move in your favor.
The strategy should work well for a small set of stocks or exchange traded funds (Etfs); however, it is necessary to find an appropriate trigger level for each issue. For this task, perform a raw-profit optimization on the DataSet. When finished, right-click the Results set and choose the option to “Apply Preferred Values (PVs) based on the highest metric per symbol.” In this way, you can easily recall a symbol’s PV trigger level for testing and trading.
A sample chart is shown in Figure 3.
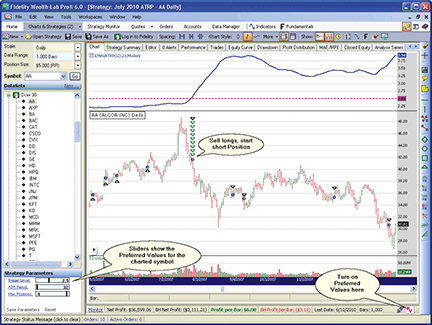
Figure 3: WEALTH-LAB, Normalized Volatility Indicator. In order to scale into multiple positions only when you’re right, long positions are added on higher troughs, whereas short positions are added after detecting lower peaks.
WealthScript code (C#):
using System;
using System.Collections.Generic;
using System.Text;
using System.Drawing;
using WealthLab;
using WealthLab.Indicators;

namespace WealthLab.Strategies
{
   public class MyStrategy : WealthScript
   {

      StrategyParameter _nviLevel;
      StrategyParameter _atrPeriod;
      StrategyParameter _maxPositions;
      public MyStrategy()
      {
         _nviLevel = CreateParameter("NVI Level", 3.7, 1, 5, 0.1);
         _atrPeriod = CreateParameter("ATR Period", 64, 30, 90, 2);
         _maxPositions = CreateParameter("Max Positions", 5, 1, 10, 1);
      }

      protected override void Execute()
      {
         double nviTrigger = _nviLevel.Value;
         int maxPositions = _maxPositions.ValueInt;
         int per = _atrPeriod.ValueInt;

         DataSeries nvi = EMA.Series( ATRP.Series(Bars, per), 21, EMACalculation.Modern);

         ChartPane nviPane = CreatePane(40, true, true);
         PlotSeries(nviPane, nvi, Color.Blue, LineStyle.Solid, 2);
         DrawHorzLine(nviPane, nviTrigger, Color.Fuchsia, LineStyle.Dashed, 2);

         for(int bar = Math.Min(3 * per, 64); bar < Bars.Count; bar++)
         {
            if (nvi[bar] > nviTrigger )
            {
               if ( CrossOver(bar, nvi, nviTrigger) )
               {
                  ExitAtMarket(bar + 1, Position.AllPositions);
                  ShortAtMarket( bar + 1, "Crossover" );
               }
               else if ( CrossUnder(bar, Momentum.Series(Low, 4), 0) )
               {
                  int ap = ActivePositions.Count;
                  if ( ap > 0 && ap < maxPositions)
                  {
                     Position p = LastPosition;
                     if ( bar - p.EntryBar > 5 && Close[bar] < p.EntryPrice )
                        ShortAtMarket( bar + 1, "Add" );
                  }
               }
            }

            if (nvi[bar] < nviTrigger )
            {
               if ( CrossUnder(bar, nvi, nviTrigger) )
               {
                  ExitAtMarket(bar + 1, Position.AllPositions);
                  BuyAtMarket( bar + 1, "Crossover" );
               }
               else if ( CrossOver(bar, Momentum.Series(High, 4), 0) )
               {
                  int ap = ActivePositions.Count;
                  if ( ap > 0 && ap < maxPositions)
                  {
                     Position p = LastPosition;
                     if ( bar - p.EntryBar > 5 && Close[bar] > p.EntryPrice )
                        BuyAtMarket( bar + 1, "Add" );
                  }
               }
            }
         }
      }
   }
}
![]() AMIBROKER: NORMALIZED VOLATILITY INDICATOR
AMIBROKER: NORMALIZED VOLATILITY INDICATOR
In “Normalized Volatility Indicator” in this issue, author Rajesh Kayakkal presents a simple indicator based on average true range.
Implementing this indicator is easy in AmiBroker Formula Language. A ready-to-use formula is presented in Listing 1. To use this formula as an indicator, simply copy it to the Afl Formula Editor and then choose Tools → Apply Indicator menu. To backtest the system based on Nvi, choose the Tools → Backtest menu in the formula editor.
LISTING 1

VPI = ATR( 64 ) / Close  * 100;

Plot( VPI, "VPI", colorRed );

x = Optimize( "x", 1.343, 1, 1.5, 0.001 );
Plot( x, "x", colorGreen );

Buy = IIf( VPI < x, sigScaleIn, 0 );
Short = IIf( VPI > x, sigScaleIn, 0 );
Sell = Cover = 0;

SetPositionSize( 1, spsShares );
A sample chart is shown in Figure 4.
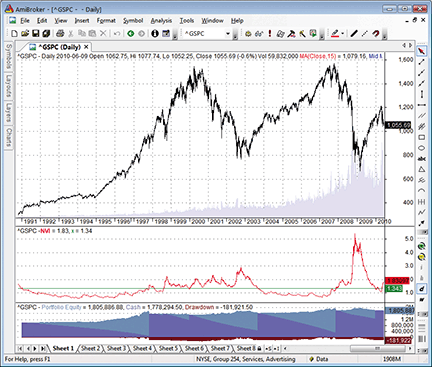
Figure 4: AMIBROKER, Normalized Volatility Indicator. Here is an S&P 500 price chart (upper pane), NVI indicator (middle pane), and resulting system equity curve.
![]() NEUROSHELL TRADER: NORMALIZED VOLATILITY INDICATOR
NEUROSHELL TRADER: NORMALIZED VOLATILITY INDICATOR
The normalized volatility indicator system described by Rajesh Kayakkal in his article in this issue can be implemented in NeuroShell Trader by combining a few of NeuroShell Trader’s 800+ indicators and NeuroShell Trader’s trading strategy wizard.
To recreate the average true range and Nvi indicator, select “New Indicator” from the Insert menu and use the Indicator Wizard to create the following indicators:
Wilder’s average true range:

ExpAvg( Subtract ( Max2(High, Lag(Close,1)), Min2( Low, Lag(Close,1))), 64 )

NVI:

Multiply2( Divide( WilderAverageTrueRange, Close ), 100 )
To recreate the normalized volatility indicator system, select “New Trading Strategy” from the Insert menu and enter the following in the appropriate locations of the Trading Strategy Wizard:
Generate a buy long market order if all of the following are true:

A<B ( NVI, 1.343 )

Generate a sell short market order if all of the following are true:

A>B ( NVI, 1.343 )
If you have NeuroShell Trader Professional, you can also choose whether the Nvi value and true range periods should be optimized. After backtesting the trading strategies, use the “Detailed Analysis” button to view the backtest and trade-by-trade statistics for each strategy.
A sample chart is shown in Figure 5.
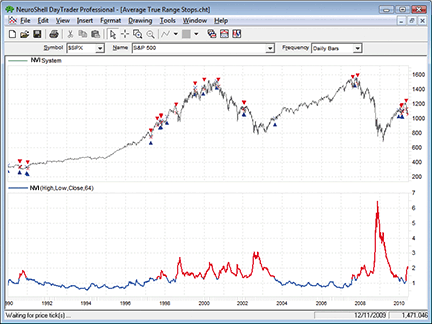
Figure 5: NEUROSHELL TRADER, Normalized Volatility Indicator
![]() WORDEN BROTHERS STOCKFINDER: NORMALIZED VOLATILITY INDICATOR
WORDEN BROTHERS STOCKFINDER: NORMALIZED VOLATILITY INDICATOR
The normalized volatility indicator presented in Rajesh Kayakkal’s article in this issue is available in the StockFinder v5 indicator library.
You can add the indicator to your chart (Figure 6) by clicking the “Add Indicator/Condition” button or by simply typing “/NVI” and choosing “normalized volatility indicator” from the list of available indicators.
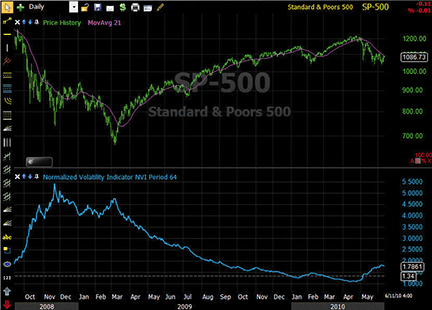
Figure 6: STOCKFINDER, Normalized Volatility Indicator. Here is an example of the NVI plotted with the S&P 500. You can adjust the ATR period by clicking on the plot to edit it.
The Nvi was constructed using RealCode, which is based on the Microsoft Visual Basic.Net framework and uses the Visual Basic (VB) language syntax. RealCode is compiled into a .Net assembly and run by the StockFinder application.
You can add indicators from the StockFinder library using the Import Indicator button on the RealCode editor, which can then be referenced in your code (Figure 7).
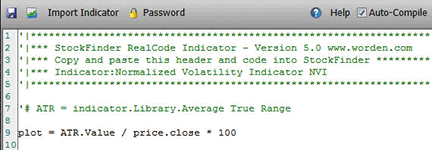
Figure 7: STOCKFINDER, STOCKFINDER LIBRARY. The ATR was added to the code using the “Import Indicator” button and referenced directly in the code using “ATR.Value.”
To download the StockFinder software and get a free trial, go to www.StockFinder.com.
![]() AIQ: NORMALIZED VOLATILITY INDICATOR
AIQ: NORMALIZED VOLATILITY INDICATOR
The Aiq code for Rajesh Kayakkal’s normalized volatility indicator (Nvi) and Nvi trading system based on his article in this issue, “Normalized Volatility Indicator,” is provided here.
I tested the author’s system on the S&P 500 Spdr (Spy) rather than on the S&P 500 index (Spx), which the author used in his article, because we can’t trade the Spx and I wanted to apply capital limitations rather than create a hypothetical test. In Figure 8, I show the consolidated (trading both long and short) portfolio equity curve using the author’s parameters for the indicator and with the Aiq pyramiding option turned on in the portfolio manager. I tried different capitalization settings in the range from 0.1% up to 2% and found that the 1% per trade with up to 100 possible positions was the setting to use with a starting balance of $500,000.
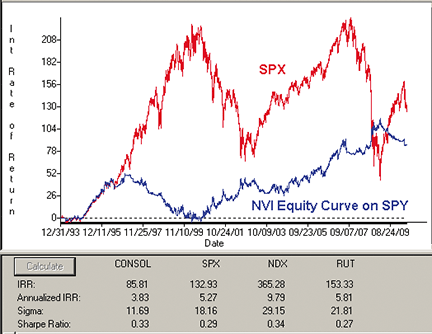
Figure 8: AIQ SYSTEMS, NVI SYSTEM ON SPY (consolidated equity curve). Here is the consolidated equity curve, trading both long and short, for the NVI system. This demonstrates trading the SPY instead of the SPX, buy and hold, over the test period 12/31/1993 to 6/11/2010.
The graph in Figure 8 compares the resulting equity curve to the Spx buy and hold, and Figure 9 compares the equity curves for trading long only versus trading short only. The system, especially the long side, outperforms the indexes on a risk-adjusted basis, which can be seen by comparing the Sharpe ratios for the system equity curves against the index’s Sharpe ratios. However, on a raw performance basis, the system underperforms all the indexes over the test period, which ran from 12/31/1993 to 6/11/2010.
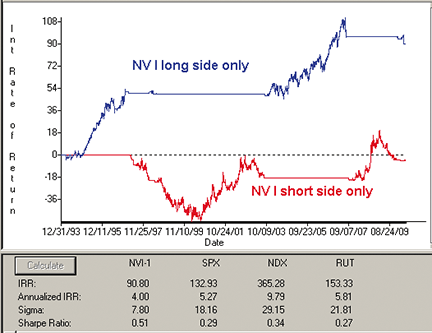
Figure 9: AIQ SYSTEMS, NVI SYSTEM ON SPY (LONG VS. SHORT). Here is the NVI system equity curve trading long only versus trading short only, on SPY over the test period 12/31/1993 to 6/11/2010.
The code can be downloaded from the Aiq website at www.aiqsystems.com and also from www.TradersEdgeSystems.com/traderstips.htm.
! NORMALIZED VOLATILITY INDICATOR
! Author: Rajesh Kayakkal
! Coded by: Richard Denning 6/4/2010
! www.TradersEdgeSystems.com

! INPUTS:
ATRLen 		is 64.
NVILevel		is 1.343.

! ABBREVIATIONS:
C 	is [close].
C1	is valresult(C,1).
H 	is [high].
L 	is [low].

! AVERAGE TRUE RANGE
TR 	is Max(H - L,max(abs(C1 - L),abs(C1- H))).
ATR	is expAvg(TR,64).
NVI	is ATR / C * 100.     ! PLOT
Buy 	if NVI < NVILevel.
Sell 	if NVI > NVILevel.
![]() TRADERSSTUDIO: NORMALIZED VOLATILITY INDICATOR
TRADERSSTUDIO: NORMALIZED VOLATILITY INDICATOR
The TradersStudio code is shown here for Rajesh Kayakkal’s normalized volatility indicator (Nvi) and his trading system, including for the scaling code in the article’s sidebar.
In the article, Kayakkal tests the indicator in a system that buys or shorts one unit of the Spx whenever the indicator is above or below a given level. Since the results he shows do not take into consideration capital limitations, and also, since we cannot trade the Spx index as such, I decided to run tests using the Russell 2000 Etf (Iwm).
The robustness of an indicator can be evaluated by examining the shape and levels of a three-dimensional graph of the parameter optimization. In this case, we have the two system parameters, the Atr length and the Nvi indicator level, that determine when to buy and sell. These two are plotted against the resulting net profit (Figures 10 and 11). I used the entire available data for the Iwm optimization.
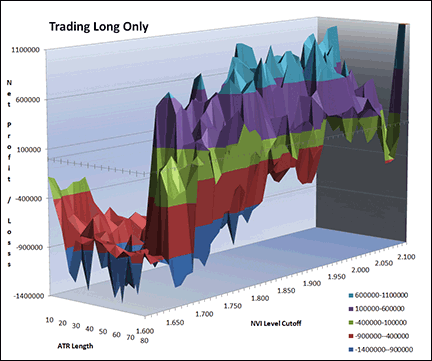
Figure 10: TRADERSSTUDIO, Normalized Volatility Indicator, TRADING LONG. This three-dimensional parameter-optimization graph shows trading on the long side only for the IWM market over the period 1/3/2001 to 6/9/2010.
To make the optimization realistic, I wanted to take into account capital limitations, so the scaling-in stops once a certain level of investment has been reached. This adds a third parameter, which does affect the total return of the system. The TradersStudio system (session) code accomplishes this objective.
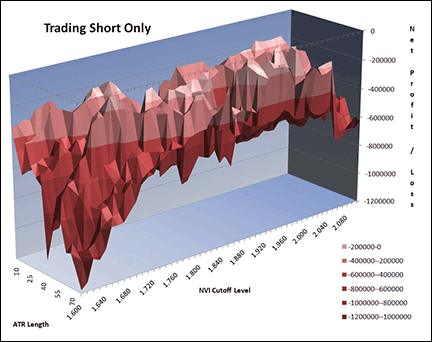
Figure 11: TRADERSSTUDIO, Normalized Volatility Indicator, TRADING SHORT. This three-dimensional parameter-optimization graph shows trading on the short side only for the IWM market over the period 1/3/2001 to 6/9/2010.
In Figures 10 and 11, I show the long side and short side parameter optimization trading the Iwm market. While most of the long side parameter sets (Figure 10) showed net gains, the surface is very peaky, and most of the short side parameter sets (Figure 11) showed a net loss for the test period from 1/3/2001 to 6/9/2010.
A robust system will have a smooth surface, with most of the parameter sets fundamentally valid, showing a net gain over the test period. I would conclude that for the Iwm market, the system is not robust and the indicator should not be used with a fixed cutoff in a system. There might be an adoptive method using the indicator that would result in more robust results.
This TradersStudio code can be downloaded from the TradersStudio website at www.TradersStudio.com → Traders Resources → FreeCode and also from www.TradersEdgeSystems.com/traderstips.htm.
' NORMALIZED VOLATILITY INDICATOR
' Author: Rajesh Kayakkal, TASC August 2010
' Coded by Richard Denning 6/6/2010

Sub NVI_SYS(atrLen,nviLevel,longOrShort,initCap,tradeStartDate)
'atrLen = smoothing length for the average true range calculation
'nviLevel = value of NVI to initiate buying (below level
            ' Or selling (above level)
'longOsShort = 0 trade short only; 1 = trade long only;
            ' 2 = trade both long And short
' initCap = initial capital balance - used to limit scaling

'tradeStartDate = date that trading is to start using
            ' the Tradestation Date format 6/1/2000 = 1000601
Dim atr
Dim nvi
atr = Average(TrueRange,atrLen)
nvi = (atr / C) * 100
' current size of the longs:
gvalue1 = getcurrentsize("LE")
' current size of the shorts:
gvalue2 = getcurrentsize("SE")
' limit scaling to initial capital
If gvalue1 * C < initCap - 200 * C And gvalue2 * C < initCap - 200 * C Then
    TradesAllowed = AllOrders
Else
    TradesAllowed = NoSameDirection
End If
' main logic to system code:
If Date >= MigrateDate(tradeStartDate) And BarNumber < LastBar -1 Then
    If longOrShort >= 1 Then
        If nvi < nviLevel Then Buy("LE",1,0,Market,Day)
    End If
    If nvi > nviLevel Then ExitLong("LX","",gvalue1,0,Market,Day)
    If (longOrShort = 0 Or longOrShort = 2) Then
        If nvi > nviLevel Then Sell("SE",1,0,Market,Day)
    End If
    If nvi < nviLevel Then ExitShort("SX","",gvalue2,0,Market,Day)
End If
' exit all trades by last bar
If BarNumber = LastBar - 1 Then
    ExitLong("LX_LB","",gvalue1,0,Market,Day)
    ExitShort("SX_LB","",gvalue2,0,Market,Day)
End If
End Sub

'-------------------------------------------------------------------------
Sub NVI_IND(atrLen,nviLevel)
    Dim atr, nvi
    atr = Average(TrueRange,atrLen)
    nvi = (atr / C) * 100
    plot1(nvi)
    plot2(nviLevel)
End Sub
'-------------------------------------------------------------------------
![]() TRADECISION: NORMALIZED VOLATILITY INDICATOR
TRADECISION: NORMALIZED VOLATILITY INDICATOR
The article by Rajesh Kayakkal in this issue, “Normalized Volatility Indicator,” demonstrates using early bear phase signals to help get out of the market before it turns down.
To recreate the normalized volatility indicator (Nvi) in Tradecision, input the following in the Strategy Builder:
Entry Long:
var
NVI:=0;
x:=#;
end_var

NVI:= AvgTrueRng(64)/close * 100;
return NVI < x;

Entry Short:
var
NVI:=0;
x:=#;
end_var

NVI:= AvgTrueRng(64)/close * 100;
return NVI > x;
To import this strategy into Tradecision, visit the area “Traders’ Tips from TASC Magazine” at www.tradecision.com/support/tasc_tips/tasc_traders_tips.htm or copy the code from the Stocks & Commodities website at www.traders.com.
A table of sample results from the strategy is shown in Figure 12.
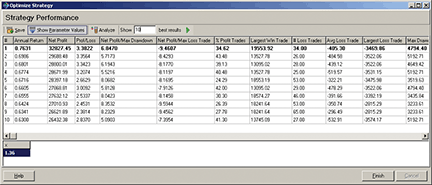
FIGURE 12: TRADECISION, Normalized Volatility Indicator. On applying the strategy with two optimized parameters (one for long and the other one for short), the summary table of strategy profits is displayed. The table lists the top 10 results sorted by the amount of profit obtained.
![]() NINJATRADER: NORMALIZED VOLATILITY INDICATOR
NINJATRADER: NORMALIZED VOLATILITY INDICATOR
The normalized volatility indicator trading strategy presented by Rajesh Kayakkal in his article in this issue has been implemented as a strategy available for download at www.ninjatrader.com/SC/August2010SC.zip.
Once it has been downloaded, from within the NinjaTrader Control Center window, select the menu File → Utilities → Import NinjaScript and select the downloaded file. This strategy is for NinjaTrader version 6.5 or greater.
You can review the strategy’s source code by selecting the menu Tools → Edit NinjaScript → Strategy from within the NinjaTrader Control Center window and selecting NVI_Strategy. The indicator source code is available by clicking Tools → Edit NinjaScript → Indicator and selecting “Nvi.”
NinjaScript indicators and strategies are compiled Dlls that run native, not interpreted, which provides you with the highest performance possible.
A sample chart implementing the strategy is shown in Figure 13.
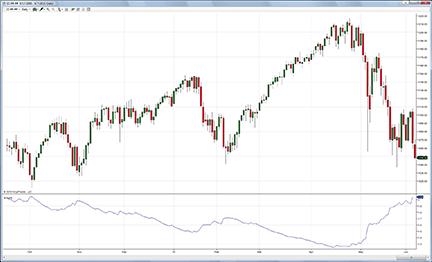
Figure 13: NINJATRADER, Normalized Volatility Indicator. This sample chart shows the NVI applied to a continuous daily chart of the emini S&P (ES ##-##).
![]() WAVE59: NORMALIZED VOLATILITY INDICATOR
WAVE59: NORMALIZED VOLATILITY INDICATOR
In his article in this issue, Rajesh Kayakkal describes how he uses his normalized volatility indicator (Nvi) to time the Spx.
After implementing Kayakkal’s indicator, we were interested to see what would happen if we replaced his standard moving average with Wave59’s adaptive version, and we were impressed with the improved accuracy of this enhanced approach. We found that the threshold level needed to be lowered to 1.13 (instead of his 1.343 setting), and we also noticed that the index worked well to mark lows in declining markets when used in a discretionary way. Note the indication for a low in the Spx in Figure 14, which was occurring as we wrote this.
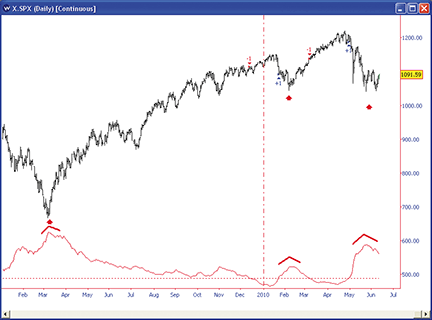
FIGURE 14: WAVE59, Normalized Volatility Indicator. Here, the indicator marks a low in a declining market.
The following script implements this indicator in Wave59. As always, users of Wave59 can download these scripts directly using the QScript Library found at www.wave59.com/library.
Indicator:  SC_Kayakkal_NVI
input: threshold(1.343);

 tr = truerange();
atr = average(tr,64);   # uncomment this line for original CPI
# atr = ama(tr,64,0.5,0.65,0.8); # uncomment this line for enhanced AMA
  nvi = 100*(atr/close);

 plot1 = nvi;
 plot2 = threshold;
 style2 = ps_dot;

 if (nvi crosses over threshold) buy(1,close,"market","onebar");
 if (nvi crosses under threshold) sell(1,close,"market","onebar");

--------------------------------------------
![]() UPDATA: NORMALIZED VOLATILITY INDICATOR
UPDATA: NORMALIZED VOLATILITY INDICATOR
This is based on the article “Normalized Volatility Indicator” in this issue by Rajesh Kayakkal. In the article, Kayakkal proposes a single measurement of volatility, which can be used to standardize it across the lifetime of an instrument. This is then compared to an optimizable threshold to enter and exit trades. All parameters are fully customizable with the Updata code.
The Updata code for this indicator has been added to the Updata Indicator Library and may be downloaded by clicking the Custom menu and then Indicator Library. Those who cannot access the library due to a firewall may paste the code shown below into the Updata Custom editor and save it.
A sample chart is shown in Figure 15.
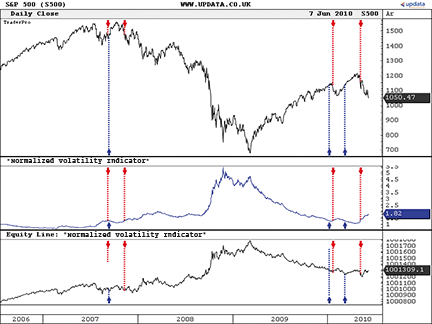
FIGURE 15: UPDATA, Normalized Volatility Indicator
NAME "Normalized Volatility Indicator"
PARAMETER "Look Back Length" #LENGTH=64
PARAMETER "Threshold" @X=1
DISPLAYSTYLE LINE
PLOTSTYLE LINE RGB(0,0,255)
INDICATORTYPE CHART
@NVI=0

FOR #CURDATE=0 TO #LASTDATE

   If #CURDATE>#LENGTH
            @NVI=ATR(#LENGTH)/CLOSE*100

      'Compares Volatility % against optimisable threshold
      if @NVI<@X
         COVER CLOSE
         BUY CLOSE
      elseif @NVI>@X
         SELL CLOSE
         SHORT CLOSE
      endif

      @PLOT=@NVI

   EndIf

NEXT
![]() CHARTSY: NORMALIZED VOLATILITY INDICATOR
CHARTSY: NORMALIZED VOLATILITY INDICATOR
For Windows + Mac + LINUX
The normalized volatility indicator described by Rajesh Kayakkal in his article this issue is available as an indicator plugin in Chartsy. To install it, please go to Tools → Plugins → Available Plugins, check “Nvi,” and click “Install.” You can find the Java source code for the indicator by clicking here.
A sample chart is shown in Figure 16. Figure 17 shows the Nvi Properties in Chartsy.
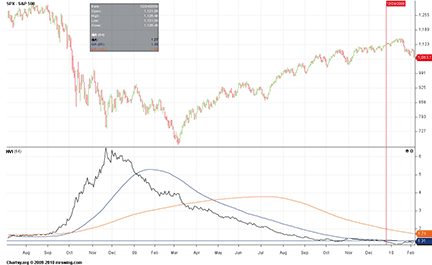
FIGURE 16: CHARTSY, Normalized Volatility Indicator
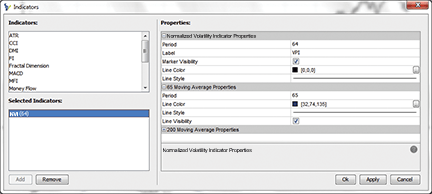
FIGURE 17: CHARTSY, Normalized Volatility Indicator properties
To download Chartsy, discuss these tools, or help us develop other tools, please visit our forum at www.chartsy.org. Our development staff can assist with your needs, and perhaps you can become a Chartsy contributor yourself.
![]() TRADESIGNAL: NORMALIZED VOLATILITY INDICATOR
TRADESIGNAL: NORMALIZED VOLATILITY INDICATOR
The normalized volatility indicator and associated trading system presented by Rajesh Kayakkal in his article in this issue can be easily implemented in the free Interactive Online Charting Tool found on www.TradesignalOnline.com (see Figure 18).
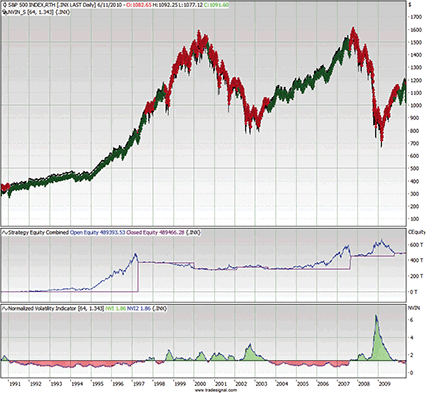
FIGURE 18: TRADESIGNAL, Normalized Volatility Indicator. Here is an example of Tradesignal Online with an NVI strategy and indicator on the S&P 500.
In the tool, select “New Strategy,” enter the code into the online code editor, and save it. The strategy can now be added to any chart with a simple drag & drop. The described strategy requires that an existing position be increased; this must first be enabled in the Tradesignal chart by setting the pyramiding parameter in the money management settings to “Yes, All” and setting max open entries to a value appropriate to your comfort level.
Both the Nvi strategy and Nvi indicator are available in the Lexicon section of the website www.TradesignalOnline.com, where they can be imported with a single click.
Meta:
       Synopsis( "The Normalized Volatility Indicator is described by
       Rajesh Kayakkal in the August 2010 Issue of Technical Analysis
                       of Stocks & Commodity." ),
       ShortCode( "NVIN_S" ),
       WebLink( "https://www.tradesignalonline.com/Lexicon/Default.aspx?name=Normalized+Volatility+Indicator+(NVIN)" );

Inputs:
       Period( 64 , 1 ),
       Pivot_Level( 1.343 );

Variable:
       nviValue;

NVIValue = ( Average( TrueRange, Period ) / Close ) * 100;

If nviValue < Pivot_Level Then begin
       If MarketPosition = MarketPositionShort Then
             Cover ("NVI SX") This Bar at Market;
       Buy ("NVI LE") This Bar at Market;
End;

If nviValue > Pivot_Level Then Begin
       If MarketPosition = MarketPositionLong Then
             Sell ("NVI LX") This Bar at Market;
       Short ("NVI SE") This Bar at Market;
End;
![]() TRADING BLOX: NORMALIZED VOLATILITY INDICATOR
TRADING BLOX: NORMALIZED VOLATILITY INDICATOR
In “Normalized Volatility Indicator” in this issue, author Rajesh Kayakkal proposes a way to identify major equity market index cycles.
The indicator and corresponding system can be implemented in Trading Blox with the following steps:
- Create a new Blox off type “Entry/Exit.” Name it “NVI System”
- Define two parameters: nvi_Pivot (floating point) and ATRDays (integer)
- Define the Atr indicator as average true range with moving average bars or ATRDays, and nvi as a calculated indicator with the formula: 100*ATR/instrument.close
- Define the entry signals in the Entry Orders script of the block as follows:
'-------------------------------------------------------------------
'Trader's Tips August 2010
'Normalized Volatility Indicator by Rajesh Kayakkal
'Code by Jez Liberty - Au.Tra.Sy
'jez@automated-trading-system.com
'https://www.automated-trading-system.com/

IF nvi < nvi_Pivot AND instrument.position <> LONG THEN
		broker.EnterLongOnOpen
ENDIF

IF nvi > nvi_Pivot AND instrument.position = SHORT THEN
		broker.EnterShortOnOpen
ENDIF

'---------------------------------------------------------------------
- Define the entry signals in the Exit Orders script of the block as follows:
'-------------------------------------------------------------------
'Trader's Tips August 2010
'Normalized Volatility Indicator by Rajesh Kayakkal
'Code by Jez Liberty - Au.Tra.Sy
'jez@automated-trading-system.com
'https://www.automated-trading-system.com/

IF nvi > nvi_Pivot AND instrument.position = LONG THEN
		broker.ExitAllUnitsOnOpen
ENDIF

IF nvi < nvi_Pivot AND instrument.position = SHORT THEN
		broker.ExitAllUnitsOnOpen
ENDIF

'---------------------------------------------------------------------
This code can be downloaded from https://www.automated-trading-system.com/free-code/.
![]() VT TRADER: NORMALIZED VOLATILITY INDICATOR
VT TRADER: NORMALIZED VOLATILITY INDICATOR
This Traders’ Tip is based on “Normalized Volatility Indicator” by Rajesh Kayakkal in this issue. The VT Trader code and instructions for recreating this indicator are as follows:
- VT Trader’s Ribbon → Technical Analysis menu → Indicators group → Indicators Builder → [New] button
- In the General tab, type the following text into each corresponding text box:
Name: TASC - 08/2010 - Normalized Volatility Indicator (NVI)
Function Name Alias: tasc_NVI
Label Mask: TASC - 08/2010 - Normalized Volatility Indicator (%periods%) = %NVI%
Placement: New Frame
Data Inspection Alias: NVI
- In the Input Variable(s) tab, create the following variables:
[New] button...
Name: periods
Display Name: Periods
Type: integer
Default: 64
- In the Output Variable(s) tab, create the following variables:
[New] button...
Var Name: NVI
Name: (NVI)
Line Color: black
Line Width: slightly thicker
Line Type: solid
- In the Formula tab, copy and paste the following formula:
{Provided By: Capital Market Services, LLC & Visual Trading Systems, LLC} {Copyright: 2010} {Description: TASC, August 2010 - "Hunting For Those Early Bear Signals: Normalized Volatility Indicator" by Rajesh Kayakkal} {File: tasc_NVI.vtscr - Version 1.0} NVI:= ATR(periods)/C*100; - Click the “Save” icon in the toolbar to finish building the normalized volatility indicator.
To attach the indicator to a chart, click the right mouse button within the chart window and then select “Add Indicator” → “TASC - 08/2010 - Normalized Volatility Indicator (Nvi)” from the indicator list. See Figure 19 for a sample chart.
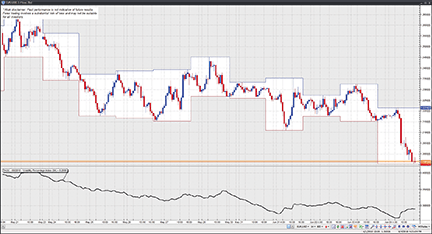
Figure 19: VT TRADER, Normalized Volatility Indicator. Here is the normalized volatility indicator on a EUR/USD one-hour candlestick chart.
To learn more about VT Trader, visit www.cmsfx.com.
Risk disclaimer: Forex trading involves a substantial risk of loss and may not be suitable for all investors.
![]() PROREALTIME: NORMALIZED VOLATILITY INDICATOR - KAYAKKAL ARTICLE CODE
PROREALTIME: NORMALIZED VOLATILITY INDICATOR - KAYAKKAL ARTICLE CODE
What is the Nvi pivot value that separates bear and bull market cycles of Spx? I ran several backtests with about 10,000 datapoints of the Spx. The code for the backtest can be seen below. Backtests were done for a range of Nvi values from 1 to 1.5, using a step of 0.001. There were many optimal values of Nvi that gave good results, and I picked the value of 1.343, which is one of the optimal values.
Prorealtime Backtest Code

nvi=averagetruerange[64]/close*100
if nvi < x then
	if shortonmarket then
	exitshort COUNTOFSHORTSHARES SHARES AT MARKET REALTIME
	endif
	buy 1 SHARES AT MARKET REALTIME
endif

if nvi > x then

	if LONGONMARKET then
		sell COUNTOFLONGSHARES SHARES AT MARKET REALTIME
	endif
	sellshort 1 SHARES AT MARKET REALTIME

endif

Optimization parameters for X are:
Minimum 1
Maximum 1.5
Step 0.001