FOREX FOCUS
Together At Last
Macd And Trendlines
Using the moving average convergence/divergence together with trendlines helps to filter out false signals.
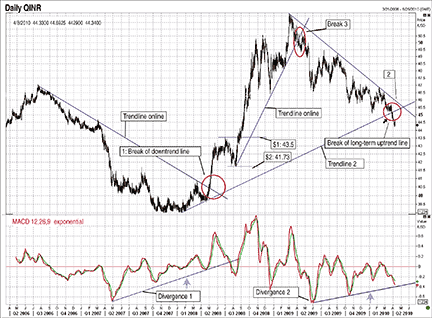
The moving average convergence/divergence (Macd) (12, 26, 9) is powerful when it comes to indicating buy and sell signals. After having applied it to my trading for quite a while, I realized that the major problem with Macd was that often, the signals turn out to be false. For example, in Figure 1, the Indian rupee/US dollar (Inr/Usd), the Macd gave a signal to buy the dollar against the rupee in the second quarter of 2007 (May 2007) when the Inr was trading at Inr/Usd 40.50/1.00. But the signal turned out to be a false one and Inr actually strengthened to Inr/Usd 39.00/1.00. Also noteworthy is how even after one year (May 2008), Inr/Usd was trading at the same level.

Figure 1: macd and trendlines. Here are three examples of how you can improve your trading results by combining the MACD with trendlines.
The same thing happened in the second quarter of 2009 when the Macd gave a signal to buy the US dollar against rupee (Inr/Usd 46.5/1), but that too turned out to be a short-term bounce and the rupee started strengthening after initial weakness to Inr/Usd 49.00/1.00. As you can see, it is now trading at Inr/Usd 44.5/1.
Divergence 1
I prefer to use the Macd to look for divergences, as Macd together with trendlines really helps in filtering out false signals. In Figure 1, you can see that in second-quarter 2007, the Indian rupee kept making lower lows and lower highs, but Macd was moving in the opposite direction, making higher lows and higher highs (displayed as “divergence 1”). This is considered to be a bullish divergence, and you should think of it as a warning for a trend change. I would not take any action on just this divergence but wait for price to cross the downsloping trendline (shown as “trendline 1”) to reverse my position (that is, sell the rupee to buy the dollar).