TRADERS’ TIPS
December 2010
Here is this month’s selection of Traders’ Tips, contributed by various developers of technical analysis software to help readers more easily implement some of the strategies presented in this and other issues.
Other code appearing in articles in this issue is posted in the Subscriber Area of our website at https://technical.traders.com/sub/sublogin.asp. Login requires your last name and subscription number (from mailing label). Once logged in, scroll down to beneath the “Optimized trading systems” area until you see “Code from articles.” From there, code can be copied and pasted into the appropriate technical analysis program so that no retyping of code is required for subscribers.
You can copy these formulas and programs for easy use in your spreadsheet or analysis software. Simply “select” the desired text by highlighting as you would in any word processing program, then use your standard key command for copy or choose “copy” from the browser menu. The copied text can then be “pasted” into any open spreadsheet or other software by selecting an insertion point and executing a paste command. By toggling back and forth between an application window and the open web page, data can be transferred with ease.
This month’s tips include formulas and programs for:
- TRADESTATION: HULL MOVING AVERAGE
- eSIGNAL: HULL MOVING AVERAGE
- METASTOCK: HULL MOVING AVERAGE
- WEALTH-LAB: HULL MOVING AVERAGE
- AMIBROKER: HULL MOVING AVERAGE
- WORDEN BROTHERS STOCKFINDER: HULL MOVING AVERAGE
- NEUROSHELL TRADER: HULL MOVING AVERAGE
- AIQ: HULL MOVING AVERAGE
- TRADERSSTUDIO: HULL MOVING AVERAGE
- TRADECISION: HULL MOVING AVERAGE
- NINJATRADER: HULL MOVING AVERAGE
- NEOTICKER: HULL MOVING AVERAGE
- WAVE59: HULL MOVING AVERAGE
- TRADE NAVIGATOR: HULL MOVING AVERAGE
- UPDATA: HULL MOVING AVERAGE
- VT TRADER: HULL MOVING AVERAGE/RSI TRADING SYSTEM
- TRADING BLOX: HULL MOVING AVERAGE
- TRADESIGNAL: HULL MOVING AVERAGE
- SHARESCOPE: HULL MOVING AVERAGE
- CHARTSY: HULL MOVING AVERAGE
- MICROSOFT EXCEL: HULL MOVING AVERAGE
- WEALTH-LAB: HULL MOVING AVERAGE — GARDNER ARTICLE CODE

![]() TRADESTATION: HULL MOVING AVERAGE
TRADESTATION: HULL MOVING AVERAGE
In the article “Trading Indexes With The Hull Moving Average” in this issue, author Max Gardner describes the calculation of the Hull moving average (Hma) and describes a trading strategy using the Hma, along with other entry and exit criteria. Here, we present the EasyLanguage code for a Hull moving average function (_Hma), a Hull moving average indicator (_Hull Moving Average), and a demonstration strategy (_Hma_MgStrategy) based on the author’s entry/exit criteria.
To download the EasyLanguage code for the function, indicator, and strategy, go to the TradeStation and EasyLanguage Support Forum (https://www.tradestation.com/Discussions/forum.aspx?Forum_ID=213) and search for the file “TradingWithHullMovingAverage.eld.”
A sample chart is shown in Figure 1.
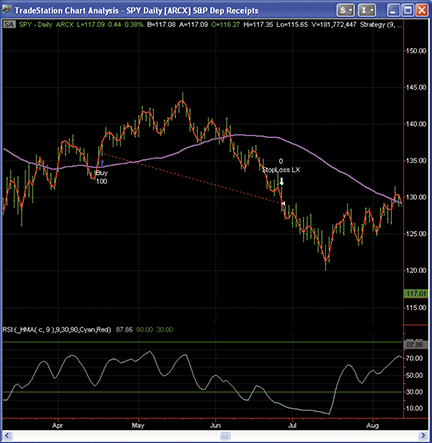
Figure 1: TRADESTATION, HULL MOVING AVERAGE. Here is a sample daily bar chart of SPY ETF displaying the indicator “_Hull moving average” (red plot, four-bar length). The magenta plot is a 50-bar simple moving average of the close. In the subgraph is the built-in RSI indicator plotting the nine-bar RSI of the nine-bar HMA as described in Max Garner’s article.
This article is for informational purposes. No type of trading or investment recommendation, advice, or strategy is being made, given, or in any manner provided by TradeStation Securities or its affiliates.
_HMA (Function)
inputs:
	Price( numericseries ),
	int Length( numericsimple) ;
once
	if Length <= 1 then
		RaiseRunTimeError( "Length must be greater than 1." ) ;

_HMA = WAverage( 2 * WAverage( Price, IntPortion( Length * 0.5 ) ) -
	WAverage( Price, Length ), IntPortion( SquareRoot( Length ) ) ) ;

_Hull Moving Average (Indicator)
inputs:
	Price( Close ), { Price for Hull Moving Average }
	Length( 20 ) ;  { Length for Hull Moving Average }

Plot1( _HMA( Price, Length ), "HMA" ) ;

_HMA_MGStrategy (Strategy)
[Intrabarordergeneration = False]

inputs:
	RSILength( 9 ), { RSI Length }
	HMALength( 9 ), { Length for Hull Moving Average }
	HMAPrice( Close ), { Price used in Hull Moving Average }
	ExitPercent( 15 ), { percentage points, i.e., 15% is entered as 15 }
	StopLossPercent( 5 ) ; { percentage points, i.e., 5% is entered as 5 }
variables:
	EP( 0 ), { holds EntryPrice for the position }
	MP( 0 ), { holds strategy MarketPosition }
	HullMA( 0 ), { holds Hull Moving Average }
	HMAForTurnUp( 0 ), { hold HMA for TurnUp determination }
	RSIofHMA( 0 ),
	HMATurnUp( false ),
	ExitTarget( 0 ), { holds exit price for target }
	StopLoss( 0 ) ; { holds stop loss price }
EP = EntryPrice ;
MP = MarketPosition ;

HullMA = _HMA( HMAPrice, HMALength ) ;
HMAForTurnUp = _HMA( HMAPrice, 4 ) ;
RSIofHMA = RSI( HullMA, RSILength ) ;

HMATurnUp = CurrentBar > 2 and HMAForTurnUp > HMAForTurnUp[1]
	and HMAForTurnUp[1] <= HMAForTurnUp[2] ;
ExitTarget = Iff( MP = 1, EP * ( 1 + ExitPercent * 0.01 ),
	Close * ( 1 + ExitPercent * 0.01 ) )  ;
StopLoss = Iff( MP = 1, EP * ( 1 - StopLossPercent * 0.01 ),
	Close * ( 1 - StopLossPercent * 0.01 ) ) ;

{ Entry Code }
If Close > Average( Close, 50 ) and
	RSIofHMA <= 50 and
	Close > Close[59] and
	HMATurnUp
then
	Buy next bar market ;

{ EXITS }
{ RSI exit delayed for RSI calculation convergence }
If CurrentBar >= 10 * RSILength and RSIofHMA >= 90 then
	Sell ( "RSI LX" ) next bar market ;

Sell ( "Target LX" ) next bar at ExitTarget Limit ; { Profit Target }
Sell ( "StopLoss LX" ) next bar at StopLoss Stop ; { Stop Loss }

![]() eSIGNAL: HULL MOVING AVERAGE
eSIGNAL: HULL MOVING AVERAGE
For this month’s Traders’ Tip, we’ve provided two formulas, HullMa.efs and Rsi_Hma_System.efs, based on the formula code from Max Gardner’s article in this issue, “Trading Indexes With The Hull Moving Average.”
The studies contain formula parameters to set the HmaPeriod, which may be configured through the Edit Studies window (Advanced Chart menu→Edit Studies). The Rsi_Hma_System.efs is configured for backtesting and contains two additional formula parameters to set the TurnUp and Sma periods.
HullMA.efs
/*********************************
Provided By:
    Interactive Data Desktop Solutions (Copyright c 2010)
    All rights reserved. This sample eSignal Formula Script (EFS)
    is for educational purposes only. Interactive Data Corporation
    reserves the right to modify and overwrite this EFS file with
    each new release.

Description
                       Moving Average by Alan Hull

Version:            1.0  13/10/2010

Notes:
	The related article is copyrighted material. If you are not
	a subscriber of Stocks & Commodities, please visit www.traders.com.

Formula Parameters:                     Default:
    HMA Period                              10
**********************************/

var fpArray = new Array();
var bVersion = null;
function preMain()
{
    setPriceStudy(true);
    setStudyTitle("HMA");
    setCursorLabelName("HMA", 0 );
    setDefaultBarFgColor(Color.red, 0);

    var x=0;
    fpArray[x] = new FunctionParameter("gHMAPeriod", FunctionParameter.NUMBER);
    with(fpArray[x++])
    {
        setName("HMA Period");
        setLowerLimit(1);
        setDefault(10);
    }
}

var bInit = false;
var xHMAArg = null;
var xHMA = null;
var xSlowWMA = null;
var xFastWMA = null;
function main(gHMAPeriod)
{
    var nBarState = getBarState();
    if (bVersion == null) bVersion = verify();
    if (bVersion == false) return;
    if (nBarState == BARSTATE_ALLBARS) {
        if (gHMAPeriod == null) gHMAPeriod = 10;
    }

    if(getCurrentBarCount() <= gHMAPeriod) return;

    if (!bInit)
    {
        xFastWMA = wma(Math.floor(gHMAPeriod/2));
        xSlowWMA = wma(gHMAPeriod);
        xHMAArg = efsInternal("calcHMAArg", xSlowWMA, xFastWMA);
        xHMA = wma(Math.floor(Math.sqrt(gHMAPeriod)),xHMAArg);
        bInit = true;
    }
    var vHMA = xHMA.getValue(0);
    if (vHMA == null) return ;

    return  vHMA;
}

function calcHMAArg(xSlowWMA, xFastWMA)
{
    var vSlowVMA = xSlowWMA.getValue(0);
    var vFastVMA = xFastWMA.getValue(0);
    if (vSlowVMA == null) return;
    return 2*vFastVMA - vSlowVMA;
}

function verify() {
    var b = false;
    if (getBuildNumber() < 779) {
        drawTextAbsolute(5, 35, "This study requires version 8.0 or later.",
            Color.white, Color.blue,
             Text.RELATIVETOBOTTOM|Text.RELATIVETOLEFT|Text.BOLD|Text.LEFT,
            null, 13, "error");
        drawTextAbsolute(5, 20, "Click HERE to
         upgrade.@URL=https://www.esignal.com/download/default.asp",
            Color.white, Color.blue,
             Text.RELATIVETOBOTTOM|Text.RELATIVETOLEFT|Text.BOLD|Text.LEFT,
            null, 13, "upgrade");
        return b;
    } else {
        b = true;
    }
    return b;
}


RSI_HMA_System.efs
/*********************************
Provided By:
    Interactive Data Desktop Solutions (Copyright c 2010)
    All rights reserved. This sample eSignal Formula Script (EFS)
    is for educational purposes only. Interactive Data Corporation
    reserves the right to modify and overwrite this EFS file with
    each new release.

 Interactive Data Corporation (Copyright © 2010)
    All rights reserved.

Description:
                    Trading Indexes With The Hull Moving Average

Version:            1.0  13/10/2010
Notes:
	The related article is copyrighted material. If you are not
	a subscriber of Stocks & Commodities, please visit www.traders.com.

Formula Parameters:                     Default:
    HMA Period                              9
    Period HMA for checking TurnUP      	4
    SMA Period                              50
**********************************/
var fpArray = new Array();
var bVersion = null;
function preMain()
{
    setPriceStudy(true);
    setStudyTitle("RSI_HMA_System");

    var x=0;
    fpArray[x] = new FunctionParameter("gPeriod", FunctionParameter.NUMBER);
    with(fpArray[x++])
    {
        setName("HMA Period");
        setLowerLimit(1);
        setDefault(9);
    }
    fpArray[x] = new FunctionParameter("gTurnUpPeriod", FunctionParameter.NUMBER);
    with(fpArray[x++])
    {
        setName("Period HMA for checking TurnUP");
        setLowerLimit(1);
        setDefault(4);
    }
    fpArray[x] = new FunctionParameter("gSMAPeriod", FunctionParameter.NUMBER);
    with(fpArray[x++])
    {
        setName("SMA Period");
        setLowerLimit(1);
        setDefault(50);
    }
}

var xCls = null;
var xHMA = null;
var xHMA4 = null;
var xRSI = null;
var xSMA = null;
var bInit = false;
var Pos = 0;
var valueBuy = 0;
var valueSell = 0;
var valueProfit = 0;
function main(gPeriod, gTurnUpPeriod, gSMAPeriod)
{
    var nBarState = getBarState();
    if (bVersion == null) bVersion = verify();
    if (bVersion == false) return;
    if (nBarState == BARSTATE_ALLBARS) {
        if (gPeriod == null) gPeriod = 9;
        if (gTurnUpPeriod == null) gTurnUpPeriod = 4;
        if (gSMAPeriod == null) gSMAPeriod = 50;
    }

    if (!bInit)
    {
        xCls = close();
        xOpn = open();
        xHMA = efsInternal("calcHullMA",gPeriod,xCls);
        xHMA4 = efsInternal("calcHullMA",gTurnUpPeriod,xCls);
        xRSI = rsi(gPeriod,xHMA);
        xSMA = sma(gSMAPeriod, xCls);
        bInit = true;
    }
    var  vRSI = xRSI.getValue(-1);
    var  vRSIPrev = xRSI.getValue(-2);
    var  vCls = xCls.getValue(-1);
    var  vSMA = xSMA.getValue(-1);
    var  vHMA4Prv = xHMA4.getValue(-2);
    var  vHMA4Cur = xHMA4.getValue(-1);
    var  vHMA4Nxt = xHMA4.getValue(0);
    var  vClsPast = xCls.getValue(-60);

    var  vOpn = xOpn.getValue(0);
    var  vRSICur = xRSI.getValue(0);

    if (vRSI == null || vClsPast ==null) return null;

    if (Strategy.isLong())
    {
        if (vRSI>=90)
        {
            valueSell = (Math.round(vOpn*100))/100;
            valueProfit = (Math.round((valueSell - valueBuy)*100))/100;
            drawShapeRelative(0, AboveBar1,  Shape.DOWNTRIANGLE, null, Color.red,
             Shape.PRESET, "sell"+Pos);
            drawTextRelative(0, AboveBar4, "Sell "+Pos+" @ "+valueSell, Color.white,
             Color.red, Text.PRESET | Text.CENTER, "Arial", 10, "stext1_"+Pos);
            drawTextRelative(0, AboveBar3, " "+valueProfit, Color.white, Color.green,
             Text.PRESET | Text.CENTER, "Arial", 10, "stext2_"+Pos);
            Strategy.doSell("Long Exit Signal", Strategy.MARKET, Strategy.THISBAR);
        }
    }
    else
    {
        if (vCls>=vSMA && vHMA4Prv>=vHMA4Cur &&
        vHMA4Cur<=vHMA4Nxt && vRSIPrev<=50 && vCls>=vClsPast)
        {
            Pos++;
            valueBuy = (Math.round(vOpn*100))/100;
            drawShapeRelative(0, BelowBar1,  Shape.UPARROW, null, Color.blue,
            Shape.PRESET,
             "buy"+Pos);
            drawTextRelative(0, BelowBar4, "Buy "+Pos+" @ "+valueBuy, Color.white,
             Color.blue, Text.PRESET | Text.CENTER, "Arial", 10, "btext"+Pos);
            Strategy.doLong("Entry Long", Strategy.MARKET, Strategy.THISBAR);
        }
    }

    if(Strategy.isLong()) setBarBgColor(Color.yellow);
}

hullMAInit = false;
var xFastWMA = null;
var xSlowWMA = null;
var xHMAArg = null;
var xHMA = null;
function calcHullMA(HMAPeriod, xCls)
{
    if(getCurrentBarCount() <= HMAPeriod) return;

    if (!hullMAInit)
    {
        xFastWMA = wma(Math.floor(HMAPeriod/2),xCls);
        xSlowWMA = wma(HMAPeriod,xCls);
        xHMAArg = efsInternal("calcHMAArg", xSlowWMA, xFastWMA);
        xHMA = wma(Math.floor(Math.sqrt(HMAPeriod)),xHMAArg);
        hullMAInit = true;
    }
    var vHMA = xHMA.getValue(0);
    if (vHMA == null) return ;

    return  vHMA;
}

function calcHMAArg(xSlowWMA, xFastWMA)
{
    var vSlowVMA = xSlowWMA.getValue(0);
    var vFastVMA = xFastWMA.getValue(0);
    if (vSlowVMA == null) return;
    return 2*vFastVMA - vSlowVMA;
}

function verify() {
    var b = false;
    if (getBuildNumber() < 779) {
        drawTextAbsolute(5, 35, "This study requires version 8.0 or later.",
            Color.white, Color.blue,
             Text.RELATIVETOBOTTOM|Text.RELATIVETOLEFT|Text.BOLD|Text.LEFT,
            null, 13, "error");
        drawTextAbsolute(5, 20, "Click HERE to
         upgrade.@URL=https://www.esignal.com/download/default.asp",
            Color.white, Color.blue,
             Text.RELATIVETOBOTTOM|Text.RELATIVETOLEFT|Text.BOLD|Text.LEFT,
            null, 13, "upgrade");
        return b;
    } else {
        b = true;
    }
    return b;
}
To discuss this study or download complete copies of the formula code, please visit the Efs Library Discussion Board forum under the Forums link from the Support menu at www.esignal.com or visit our Efs KnowledgeBase at https://www.esignal.com/support/kb/efs/. The eSignal formula scripts (Efs) are also available for copying and pasting from the Stocks & Commodities website at Traders.com.
Sample charts of the Hull moving average and moving average system are shown in Figures 2 and 3.
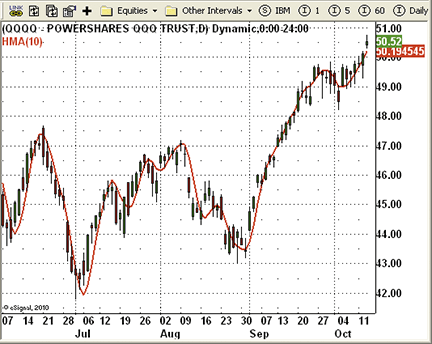
Figure 2: eSIGNAL, HULL MOVING AVERAGE
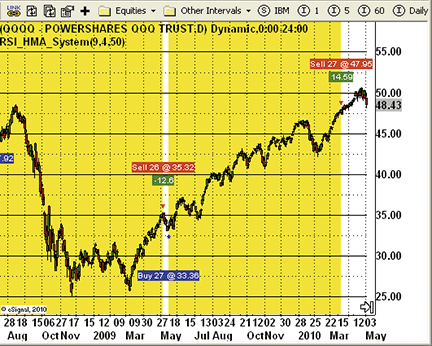
Figure 3: eSIGNAL, HULL MOVING AVERAGE and HMA/RSI SYSTEM

![]() METASTOCK: HULL MOVING AVERAGE
METASTOCK: HULL MOVING AVERAGE
Max Gardner’s article in this issue, “Trading Indexes With The Hull Moving Average,” describes the Hull moving average and a system using it. You can add the average to MetaStock using these steps:
- In the Tools menu, select Indicator Builder.
- Click New to open the Indicator Editor for a new indicator.
- Type the name of the indicator.
- Click in the larger window and paste or type in the following formula:
hmap := input("Moving Average Periods",1, 200, 20); Mov((2*Mov(C,hmap/2,W))-Mov(C,hmap,W), LastValue(Sqrt(hmap)),W) - Click OK to close the Indicator Editor.
The system test formulas require MetaStock 10.0 or later. The steps to create the system test are:
- Select Tools → the Enhanced System Tester.
- Click New
- Enter a name.
- Select the Buy Order tab and enter the following formula:
hmap:= 4; { Hull Moving Average time periods } hma:= Mov((2*Mov(C,hmap/2,W))-Mov(C,hmap,W), LastValue(Sqrt(hmap)),W); el:=C > Mov(C,50,S) AND ROC(hma,1,$) > 0 AND RSI(hma,9) < 50 AND C > Ref(C, -59); xl:= RSI(hma,9) > 90; trade:= If(PREV<=0, If( el, C, 0), If((C-PREV)/If(PREV=0,-1,PREV) < -0.05, -1, If((C-PREV)/If(PREV=0,-1,PREV) > 0.15, -2, If(xl, -3, PREV)))); Cross(trade >0, 0.5); - Select the Sell Order tab and enter the following formula:
hmap:= 4; { Hull Moving Average time periods } hma:= Mov((2*Mov(C,hmap/2,W))-Mov(C,hmap,W), LastValue(Sqrt(hmap)),W); el:=C > Mov(C,50,S) AND ROC(hma,1,$) > 0 AND RSI(hma,9) < 50 AND C > Ref(C, -59); xl:= RSI(hma,9) > 90; trade:= If(PREV<=0, If( el, C, 0), If((C-PREV)/If(PREV=0,-1,PREV) < -0.05, -1, If((C-PREV)/If(PREV=0,-1,PREV) > 0.15, -2, If(xl, -3, PREV)))); trade < 0 - Click OK to close the system editor.

![]() WEALTH-LAB: HULL MOVING AVERAGE
WEALTH-LAB: HULL MOVING AVERAGE
This Traders’ Tip is based on “Trading Indexes With The Hull Moving Average” by Max Gardner in this issue.
Because the Hull moving average (Hma) has been a part of the free “Community Indicators” library driven by the Wealth-Lab user community, applying it to charts and strategies is as easy as drag & drop.
To run this Wealth-Lab 6 code that implements Gardner’s Rsi/Hma system for trading indexes, install the indicator library (or update to the actual version using the Extension Manager tool) from the www.wealth-lab.com site, Extensions section.
Plotted as a blue line on Figure 4, the Hull moving average appears to be a truly responsive one, providing timely short-term signals when it turns up. Depicted on the upper pane for comparison to the nine-day Rsi of a nine-day Hma, the Rsi of a simple moving average (Sma) within the same period (violet line) visibly lags its counterpart.
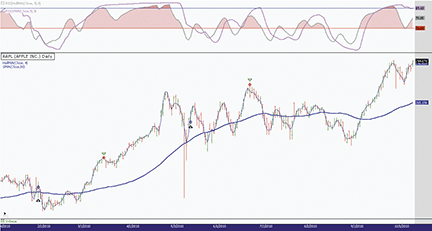
Figure 4: WEALTH-LAB, HULL MOVING AVERAGE SYSTEM. This Wealth-Lab Developer 6.0 chart shows Max Gardner’s RSI/HMA applied to Apple Inc. (AAPL, daily). The Hull moving average (plotted as a blue line) appears to be a responsive one, providing timely, short-term signals when it turns up. The upper pane shows the RSI of SMA within the same period (violet line) for comparison, and it visibly lags its counterpart.
C# Code:

using System;
using System.Collections.Generic;
using System.Text;
using System.Drawing;
using WealthLab;
using WealthLab.Indicators;
using Community.Indicators;

namespace WealthLab.Strategies
{
	public class TradersTips201012 : WealthScript
	{
		private StrategyParameter paramPT;
		private StrategyParameter paramSL;

		public TradersTips201012()
		{
			paramPT = CreateParameter("Profit Target %",10,1,100,1);
			paramSL = CreateParameter("Stop Loss %",10,1,100,1);
		}

		protected override void Execute()
		{
			DataSeries ma = SMA.Series(Close, 50);
			HullMA hma4 = HullMA.Series(Close,4);
			DataSeries rsiHma = RSI.Series( HullMA.Series(Close,9), 9 );
			Color tp = Color.Transparent;
			LineStyle ls = LineStyle.Solid;

			ChartPane paneRsi = CreatePane(35,true,true);
			PlotSeries(PricePane,hma4,Color.Blue,LineStyle.Solid,1);
			PlotSeries(PricePane,SMA.Series(Close,50),Color.Blue,LineStyle.Solid,2);
			PlotSeriesOscillator( paneRsi, rsiHma, 50, 0,
				Color.FromArgb( 50, Color.Red ), tp, Color.DarkGray, ls, 2);
			PlotSeriesOscillator( paneRsi, rsiHma, 90, 0,
				Color.FromArgb( 70, Color.Red ), tp, tp, ls, 2);
			PlotSeries(paneRsi,RSI.Series(SMA.Series(Close,9),9),Color.Violet,ls,2);
			DrawHorzLine( paneRsi, 90, Color.Blue, ls, 1 );
			DrawHorzLine( paneRsi, 50, Color.Red, ls, 1 );

			for(int bar = GetTradingLoopStartBar(60); bar < Bars.Count; bar++)
			{
				SetBackgroundColor( bar, Color.FromArgb( 10, Color.Cyan ) );
				if (IsLastPositionActive)
				{
					Position p = LastPosition;
					double Stop = p.EntryPrice * (1 - paramSL.Value / 100.0d);
					double Target = p.EntryPrice * (1 + paramPT.Value / 100.0d);
                    					bool hmaRsiOver90 = rsiHma[bar] > 90;

					if( hmaRsiOver90 )
						ExitAtMarket(bar + 1, p);
					else if( !ExitAtStop(bar + 1, p, Stop ) )
						ExitAtLimit(bar + 1, p, Target );
				}
				else
				{
					bool closeOverSMA = (Close[bar] > ma[bar]);
					bool hmaUpside = TurnUp(bar, hma4);
					bool hmaRsiBelow50 = rsiHma[bar] <= 50;
					bool closeOverOldClose = (Close[bar] > Close[bar-59]);

					if ( closeOverSMA && hmaUpside &&
						hmaRsiBelow50 && closeOverOldClose )
							if( BuyAtMarket(bar + 1) != null )
								LastPosition.Priority = -rsiHma[bar];
				}
			}
		}
	}
}

![]() AMIBROKER: HULL MOVING AVERAGE
AMIBROKER: HULL MOVING AVERAGE
Implementing the Hma/Rsi system presented by Max Gardner in his article in this issue (“Trading Indexes With The Hull Moving Average”) is easy in AmiBroker Formula Language.
A ready-to-use formula for the article is presented in the Listing 1. The code includes both indicator code trading strategy code. The formula can be used in the Automatic Analysis window for backtesting as well as to plot it in a chart (Figure 5). To use it, enter the formula in the Afl Editor, then press the Insert Indicator button to see the chart, or press Backtest to perform a historical test of the strategy.
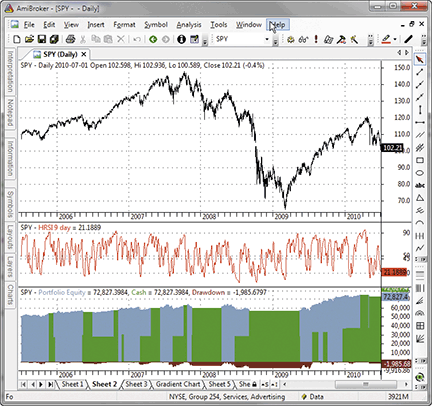
Figure 5: AMIBROKER, HULL MOVING AVERAGE STRATEGY. This daily chart of the SPY (green) with a nine-bar RSI from HMA (middle pane) shows the portfolio system test equity.
Note that this strategy can produce different results depending on symbol selection rules. You can modify the symbol selection strategy by adding your own PositionScore rules.
LISTING 1

function HMA( array, period )
{
 fast = WMA( array, period / 2 );
 slow = WMA( array, period );

 return WMA( 2 * fast - slow, sqrt( period ) );
}

function TurnUp( array )
{
  return array > Ref( array, -1 ) AND Ref( array, -1 ) < Ref( array, -2 );
}

Hrsi = RSIa( HMA( Close, 9 ), 9 );

Plot( Hrsi, "HRSI 9 day", colorRed );
PlotGrid( 20 );
PlotGrid( 45 );
PlotGrid( 50 );
PlotGrid( 90 );

ApplyStop( stopTypeLoss, stopModePercent, 5 );
ApplyStop( stopTypeProfit, stopModePercent, 15 );

Sell = Hrsi >= 90;
Buy = Close > MA( Close, 50 ) AND
      TurnUp( HMA( Close, 4 ) ) AND
      Ref( Hrsi, -1 ) <= 50 AND
      Close > Ref( Close, -59 );

SetTradeDelays( 1, 1, 1, 1 );
BuyPrice = SellPrice = Open;
SetPositionSize( 50, spsPercentOfEquity );

![]() WORDEN BROTHERS STOCKFINDER: HULL MOVING AVERAGE
WORDEN BROTHERS STOCKFINDER: HULL MOVING AVERAGE
You can download the layout “December 2010 Traders Tips” from the StockFinder share library by clicking Share, Browse, and then searching the Layouts tab.
We used RealCode to recreate the Hull moving average, and we used the BackScanner to test the strategy from Max Gardner’s article in this issue, “Trading Indexes With The Hull Moving Average.” A sample chart is shown in Figure 6.
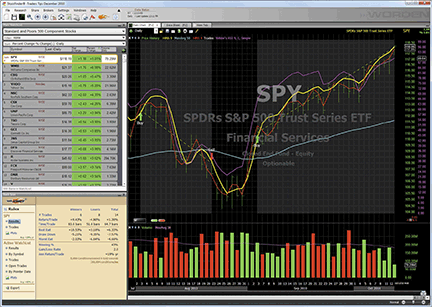
Figure 6: STOCKFINDER, HULL MOVING AVERAGE
For more information or to start a free trial of StockFinder, please visit www.StockFinder.com.

![]() NEUROSHELL TRADER: HULL MOVING AVERAGE
NEUROSHELL TRADER: HULL MOVING AVERAGE
The Hull moving average (Hma) described in the article by Max Gardner in his article in this issue, “Trading Indexes With The Hull Moving Average,” can be easily implemented with a few of NeuroShell Trader’s 800+ indicators. Simply select “New Indicator...” from the Insert menu and use the Indicator Wizard to set up the following indicator:
HMA(Close, 9) = LinWgtMovAvg( Subtract( Multiply( 2, LinWgtMovAvg(Close, 4)),
 LinWgtMovAvg(Close, 9)), 3)

HMA(Close, 4) = LinWgtMovAvg( Subtract( Multiply( 2, LinWgtMovAvg(Close, 2)),
 LinWgtMovAvg(Close, 4)), 2)
To recreate the Hma/Rsi trading system, select “New Trading Strategy...” from the Insert menu and enter the following in the appropriate locations of the Trading Strategy Wizard:
Generate a buy long market order if all of the following are true:
A>B ( Close, MovAvg( Close, 50 ))
A>B ( Change( HMA (Close,4),1), 0)
A<=B( Lag( RSI( HMA(Close,9), 9)), 50)
A>B( Close, Lag(Close,59))
Generate a protective stop order at the following price level:
TrailPrice%(Trading Strategy, 5)
Generate a sell short market order if ONE of the following is true:
	A>=B ( RSI( HMA(Close, 9), 9), 90 )
	TargetPrice%(Trading Strategy,15)
If you have NeuroShell Trader Professional, you can also choose whether the parameters should be optimized. After backtesting the trading strategies, use the “Detailed analysis...” button to view the backtest and trade-by-trade statistics for each strategy.
Users of NeuroShell Trader can go to the Stocks & Commodities section of the NeuroShell Trader free technical support website to download a copy of this or any previous Traders’ Tips.
A sample chart is shown in Figure 7.
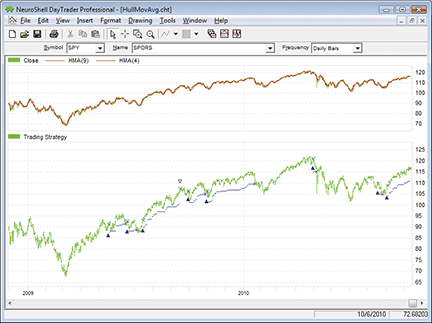
Figure 7: NEUROSHELL TRADER, HULL MOVING AVERAGE. This chart shows the Hull moving average indicator along with the RSI and HMA trading system.

![]() AIQ: HULL MOVING AVERAGE
AIQ: HULL MOVING AVERAGE
The Aiq code is given here for “Trading Indexes With The Hull Moving Average” by Max Gardner in this issue.
Only the indicators that are used in his system are coded, since the weighted moving averages must be coded longhand.
In Figure 8, I show the results of a backtest on all trades for 71 Etfs that have 10 years or more of history. The test period is from 9/29/2000 to 10/13/2010. In this summary report, the average trade is 1.58% with an 81-bar average holding period. Assuming you would trade all signals from all 71 markets, the average annual return is 7.12% compared to a loss of -1.97% per year on the S&P 500 index over this 10-year test period.
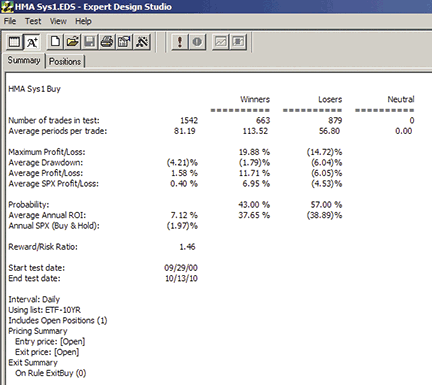
Figure 8: AIQ SYSTEMS, HULL MOVING AVERAGE SYSTEM, BACKTEST RESULTS. Here is a summary EDS report for Max Gardner’s HMA/RSI system as applied to a 71-ETF portfolio over the period 9/29/2000 to 10/13/2010.
The code and Eds file can be downloaded from www.TradersEdgeSystems.com/traderstips.htm.
! TRADING INDEXES WITH THE HULL MOVING AVERAGE
! Author: Max Gardner
! Coded by Richard Denning 10/12/2010
! www.TradersEdgeSystems.com

! HULL MOVING AVERAGE CALCULATION:
C is [close].
C1 is valresult(C,1).
C2 is valresult(C,2).
C3 is valresult(C,3).
C4 is valresult(C,4).
C5 is valresult(C,5).
C6 is valresult(C,6).
C7 is valresult(C,7).
C8 is valresult(C,8).

WMA2 is (2*C+C1)/(2+1).
WMA4 is (4*C+3*C1+2*C2+C3) / (4+3+2+1).
WMA9 is (9*C+8*C1+7*C2+6*C3+5*C4+4*C5+3*C6+2*C7+C8)
	/ (9+8+7+6+5+4+3+2+1).
HMA4dif is 2*WMA2-WMA4.
HMA4dif1 is valresult(HMA4dif,1).

HMA9dif is 2*WMA4-WMA9.
HMA9dif1 is valresult(HMA9dif,1).
HMA9dif2 is valresult(HMA9dif,2).

HMA4 is (2*HMA4dif+HMA4dif1)/ (2+1).
HMA9 is (3*HMA9dif+2*HMA9dif1+HMA9dif2)/ (3+2+1).

!! RSI OF HMA9:
!To convert Wilder Averaging to Exponential Averaging use this formula:
!ExponentialPeriods = 2 * WilderPeriod - 1.
W1	is 9.
U 	is HMA9 - valresult(HMA9,1).
D 	is valresult(HMA9,1) - HMA9.
rsiLen1	is 2 * W1 - 1.
AvgU 	is ExpAvg(iff(U>0,U,0),rsiLen1).
AvgD 	is ExpAvg(iff(D>=0,D,0),rsiLen1).
rsi9HMA9 is 100-(100/(1+(AvgU/AvgD))).

! SIMPLE 50 BAR MOVING AVERAGE OF CLOSE:
SMA50 	is simpleavg(C,50).

!! TRADING SYSTEM USING HULL MOVING AVERAGE:
Rule1 	if C > SMA50.
Rule2 	if HMA4 > valresult(HMA4,1).
Rule3 	if rsi9HMA9 < 50.
Rule4	if C > valresult(C,59).
sRule1	if rsi9HMA9 > 90.
sRule2	if C >= {position entry price} * 1.15.
sRule3	if C <= {position entry price} * 0.95.

Buy	if Rule1 and Rule2 and Rule3 and Rule4.
ExitBuy	if sRule1 or sRule2 or sRule3.
![]() TRADERSSTUDIO: HULL MOVING AVERAGE
TRADERSSTUDIO: HULL MOVING AVERAGE
The TradersStudio code for Max Gardner’s article in this issue, “Trading Indexes With The Hull Moving Average,” is provided here. The coded version that I have supplied also includes the system that Gardner presents in his article.
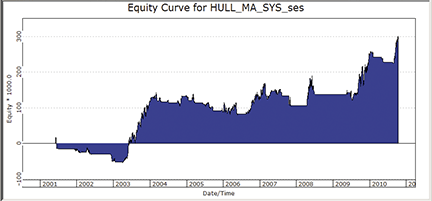
Figure 9: TRADERSSTUDIO, HULL MOVING AVERAGE SYSTEM ON FOUR INDEX FUTURES. Here is the consolidated equity curve for the period 12/28/2000 to 10/12/2010.
I tested this system with the parameters he provides in his article on a four-index futures portfolio consisting of the full-sized contracts for the Dow Jones Industrials (DJ), Nasdaq 100 (ND), S&P 500 (SP), and S&P Midcap 400 (MD) index. The resulting equity curve is shown in Figure 9. In addition, the table in Figure 10 shows the summary results by market.
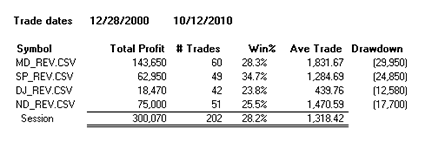
Figure 10: TRADERSSTUDIO, HMA SYSTEM RESULTS BY MARKET. Here are the summary results by market for the full-sized futures contract portfolio.
The code can be downloaded from the TradersStudio website at www.TradersStudio.com→Traders Resources→FreeCode or www.TradersEdgeSystems.com/traderstips.htm.
' TRADING INDEXES WITH THE HULL MOVING AVERAGE
' Author: Max Gardner
' Coded by Richard Denning 10/6/2010
' www.TradersEdgeSystems.com

Function HULL_MA(HMAlen as integer)
Dim HMA As BarArray
Dim WMA1 As BarArray
Dim WMA2 As BarArray
Dim halfLen As Integer
halfLen = HMAlen/2
WMA1 = weightedMA(C,HMAlen,0)
WMA2 = weightedMA(C,halfLen,0)
HMA = weightedMA(2*WMA2-WMA1,Sqr(HMAlen),0)
HULL_MA = HMA
End Function
'-----------------------------------------------

Sub HULL_MA_SYS(SMAlen,HMAlen1,HMAlen2,RSIlen,RSIbuyLvl,trendLen,RSIsellLvl,ptPct,slPct)
Dim SMA As BarArray
Dim HMA1 As BarArray
Dim HMA2 As BarArray
Dim RSI_HMA As BarArray
Dim Rule1 As Boolean
Dim Rule2 As Boolean
Dim Rule3 As Boolean
Dim Rule4 As Boolean
Dim sRule1 As Boolean
Dim sRule2 As Boolean
Dim sRule3 As Boolean

SMA = Average(C,SMAlen)
HMA1 = HULL_MA(HMAlen1)
HMA2 = HULL_MA(HMAlen2)
RSI_HMA = rsi(HMA2,RSIlen,0)

Rule1 = C > SMA
Rule2 = HMA1 > HMA1[1]
Rule3 = RSI_HMA < RSIbuyLvl
Rule4 = C > C[trendLen]

sRule1 = RSI_HMA > RSIsellLvl
sRule2 = C >= EntryPrice * (1 + ptPct/100)
sRule3 = C <= EntryPrice + (1 - slPct/100)

If Rule1 And Rule2 And Rule3 And Rule4 Then
    Buy("LE",1,0,Market,Day)
End If

If sRule1 Or sRule2 Or sRule3 Then
    ExitLong("LX","",1,0,Market,Day)
End If

End Sub

![]() TRADECISION: HULL MOVING AVERAGE
TRADECISION: HULL MOVING AVERAGE
Max Gardner’s article in this issue, “Trading Indexes With The Hull Moving Average,” introduces a market timing system that removes lag and forecasts future data.
To recreate Gardner’s Hma function, input the following into Tradecision’s Function Builder:
HMA Function:
function (Length:Numeric=9):Numeric;
return WMA(2 * WMA(C,Length/2) - WMA(C,Length),SquareRoot(Length));
To recreate Gardner’s Hma indicator, input the following into Tradecision’s Indicator Builder:
HMA Indicator:
input
Length:"Enter the Length:", 9;
end_input

return HMA(Length);
To recreate Gardner’s Hma strategy, input the following into Tradecision’s Strategy Builder:
Entry Rule:
return Close > SMA(C,50) and HMA(4) > HMA(4)\1\ and
HMA(4)\1\ <= HMA(4)\2\ and HMA(4)\2\ <= HMA(4)\3\ and
RSI(HMA(9),9) <= 50 and Close >  Close\59\;

Exit Rule:
return RSI(HMA(9),9) >= 90;
Note that the stop-loss and take-profit exit rules are set in the money management section.
To import the strategy into Tradecision, visit the area “Traders’ Tips from Tasc Magazine” at www.tradecision.com/support/tasc_tips/tasc_traders_tips.htm or copy the code from the Stocks & Commodities website at www.traders.com.
A sample chart is shown in Figure 11.
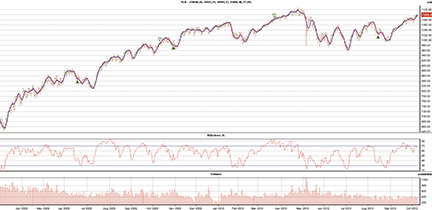
FIGURE 11: TRADECISION, HULL MOVING AVERAGE/RSI STRATEGY. Here we see two indicators plotted on the Dow Jones Industrial Average (DJIA) chart with buy and sell signals generated by the HMA trading strategy.

![]() NINJATRADER: HULL MOVING AVERAGE
NINJATRADER: HULL MOVING AVERAGE
The HmaTradingStrategy automated strategy presented by Max Gardner in his article in this issue, “Trading Indexes With The Hull Moving Average,” has now been implemented as a strategy available for download at www.ninjatrader.com/SC/December2010SC.zip.
Once it has been downloaded, from within the NinjaTrader Control Center window, select the menu File→Utilities→Import NinjaScript and select the downloaded file. This strategy is for NinjaTrader version 6.5 or greater.
You can review the Strategy source code by selecting the menu Tools→Edit NinjaScript→Strategy from within the NinjaTrader Control Center window and selecting HmaTradingStrategy.
NinjaScript uses compiled Dlls that run native, not interpreted, which provides you with the highest performance possible.
A sample chart implementing the strategy is shown in Figure 12.
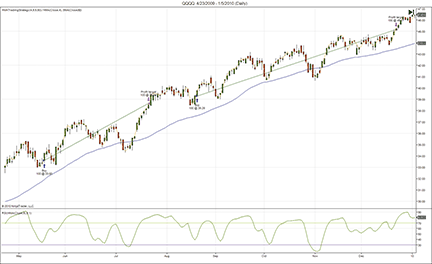
Figure 12: NINJATRADER, HULL MOVING AVERAGE. This screenshot shows the HMATradingStrategy applied to a daily chart of the NASDAQ ETF (QQQQ).

![]() NEOTICKER: HULL MOVING AVERAGE
NEOTICKER: HULL MOVING AVERAGE
In “Trading Indexes With The Hull Moving Average” in this issue, author Max Gardner presents a trading signal based on the Hull moving average. This trading system can be implemented in NeoTicker using formula language.
The trading system is a formula language indicator named “Tasc Hull Moving Average System” (Listing 1) with no parameters. It produces one plot output that shows the current system equity (Figure 13).
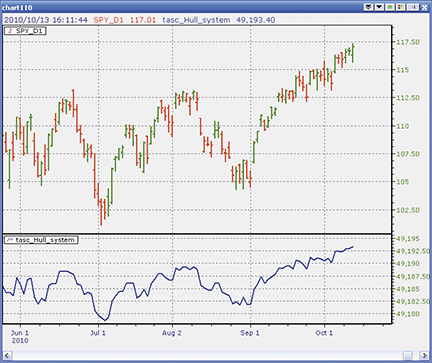
Figure 13: NEOTICKER, HULL MOVING AVERAGE SYSTEM. The trading system implemented in NeoTicker produces one plot output that shows the current system equity.
A downloadable version of the trading system will be available at the NeoTicker blog site (https://blog.neoticker.com).
LISTING 1
' 4-day Hull Moving Average
HMA4 := waverage(0,(2*waverage(data1,2)-waverage(data1,4)),sqrt(4));
' 9 day Hull Moving Average
HMA9 := waverage(0,(2*waverage(data1,4)-waverage(data1,9)),sqrt(9));
longatmarket ((close > average(data1, 50)) and
              (HMA4 > HMA4(1)) and
              (RSindex(HMA9, 9) <= 50) and
              (close > close(59)),
              defaultordersize);
' profit target
longexitatmarket ((openpositionlong > 0) and
                  (close > openpositionentryprice*1.15),
                   defaultordersize);
' stop loss
longexitatmarket ((openpositionlong > 0) and
                  (close < openpositionentryprice*0.95),
                  defaultordersize);
plot1 := currentequity;

![]() WAVE59: HULL MOVING AVERAGE
WAVE59: HULL MOVING AVERAGE
In his article in this issue, “Trading Indexes With The Hull Moving Average,” author Max Gardner describes the smoothed weighted average, the Hull moving average (Hma).
Figure 14 shows the standalone indicator on the December S&P emini.
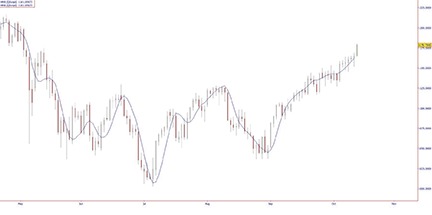
FIGURE 14: WAVE59, HULL MOVING AVERAGE. Here is the Hull moving average (HMA) on the December S&P emini as a standalone indicator.
The following script implements this indicator in Wave59. As always, users of Wave59 can download these scripts directly using the QScript Library found at https://www.wave59.com/library.
Indicator:  SC_Max_Gardner_HMA
input: length(16), Color(blue), Thickness(1);
if (barnum==barsback)
{
n,x,y,z,a,hma = 0;
}

N = length/2;
x = (2*waverage(c,n));
y= waverage(c,length);
z = x - y;

A = sqrt(length);
hma = waverage(z,a);
plot1=hma;
color1=color;
thickness1=thickness;
------------------------------------------------------

![]() TRADE NAVIGATOR: HULL MOVING AVERAGE
TRADE NAVIGATOR: HULL MOVING AVERAGE
Trade Navigator offers all the features you need to recreate the Hull moving average strategy presented in Max Gardner’s article in this issue, “Trading Indexes With The Hull Moving Average.”
First, in Trade Navigator, go to the Strategies tab in the Trader’s Toolbox. Click on the New button, then click the New Rule button. To set up the long entry rule, input the following code:
IF Close > MovingAvg (Close , 50) And Hull Moving Average (Close , 4) >
 Hull Moving Average (Close , 4).1
 And RSI (Hull Moving Average (Close , 9) , 9 , False) < 50 And Close > Close.59
Set the action to “Long Entry (Buy)” and the order type to “Market.” (See Figure 15.) Click the Save button. Type a name for the rule and then click the OK button.
Repeat these steps for the long exit rules using the following sets of code:
IF RSI (Hull Moving Average (Close , 9) , 9 , False) > 90
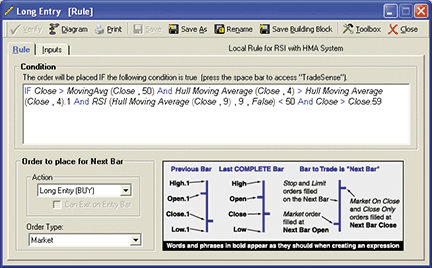
Figure 15: TRADE NAVIGATOR, HULL MOVING AVERAGE STRATEGY
Set the action to “Long Exit (Sell)” and the order type to “Market.” Click the Save button. Type a name for the rule and then click the OK button.
IF True
Set the action to “Long Exit (Sell)” and the order type to “Limit.” Type the “limit price” code in the box as follows:
Entry Price + Entry Price * (percentage / 100)
Click Verify, then click Add. Set the default value for percentage to “15.” Click the Save button. Type a name for the rule and then click the OK button.
IF True
Set the action to “Long Exit (Sell)” and the order type to “Stop.” Type the “limit price” code in the box as follows:
Entry Price + Entry Price * (percentage / 100)
Click Verify, then click Add. Set the default value for percentage to “5.” Click the Save button. Type a name for the rule and then click the OK button.
Save the strategy by clicking the Save button, typing a name for the strategy, and then clicking the OK button.
You can test your new strategy by clicking the Run button to see a report, or you can apply the strategy to a chart for a visual representation of where the strategy would place trades over the history of the chart.
Genesis has prepared this strategy as a downloadable file for Trade Navigator. To download it, click on the blue phone icon in Trade Navigator, select Download Special File, type “SC1012,” and click the Start button. The library name will be “Trading Indexes with the Hma” and the strategy name will be “Rsi with Hma System.”
A sample chart is shown in Figure 15.

![]() UPDATA: HULL MOVING AVERAGE
UPDATA: HULL MOVING AVERAGE
This Traders’ Tip is based on “Trading Indexes With The Hull Moving Average” by Max Gardner in this issue.
The Hull moving average (Hma) is created from a weighted averaging of the difference between longer- and shorter-term weighted averages. The author creates a market model using this Hull moving average together with a long-term simple moving average and oscillation and momentum indicators to time entry into long-term moves.
The new Updata Professional version 7 accepts code written in VB.Net and C# in addition to our user-friendly custom code. Versions of this indicator and system in all these languages may be downloaded by clicking the Custom menu and then System or Indicator Library. Those who cannot access the library due to firewall issues may paste the code below into the Updata Custom editor and save it.
A sample chart is shown in Figure 16.
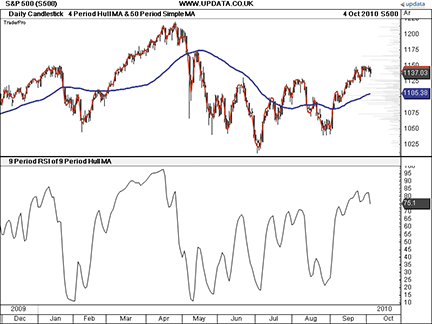
FIGURE 16: UPDATA, HULL MOVING AVERAGE. This sample chart shows the Hull moving average (red) with the longer-term simple moving average (blue) on the S&P 500 index. Backtesting the system shows early entries to long-term trends.
'Hull Moving Average System

PARAMETER "Hull Moving Average Period" #HMAPERIOD=4
PARAMETER "Simple Moving Average Period" #SMAPERIOD=50
PARAMETER "RSI Period" #RSIPERIOD=9

DISPLAYSTYLE 3LINES
PLOTSTYLE THICK2 RGB(255,0,0)
PLOTSTYLE2 THICK2 RGB(0,0,255)
INDICATORTYPE TOOL
INDICATORTYPE3 CHART
@RSI=0
@WMADIFF=0
@SMA=0
@HMA=0
#SQRT=0
@ENTRYPRICE=0

FOR #CURDATE=(#HMAPERIOD+#SMAPERIOD+#RSIPERIOD) TO #LASTDATE

   @SMA=MAVE(#SMAPERIOD)
   #SQRT=EXPBASE(#HMAPERIOD,0.5)
   @WMADIFF=2*WAVE(#HMAPERIOD/2)-WAVE(#HMAPERIOD)
   @HMA=SGNL(@WMADIFF,#SQRT,W)
   'BUILDS RSI OF 9 PERIOD HULL MOV. AVG.
   @RSI=STUDY(RSI(#RSIPERIOD),SGNL(2*WAVE(INT(9/2))-WAVE(9),3,W))

   'EXIT RULES
   If ORDERISOPEN=1
      if @RSI>90
         SELL CLOSE
       elseif CLOSE>1.15*@ENTRYPRICE
        SELL CLOSE
      elseif CLOSE<0.95*@ENTRYPRICE
        SELL CLOSE
      endif
  EndIf

  'ENTRY RULES
  If CLOSE>@SMA AND @HMA>HIST(@HMA,1) AND @RSI<50 AND CLOSE>CLOSE(59)
     BUY CLOSE
     @ENTRYPRICE=CLOSE
  EndIf

  @PLOT=@HMA
  @PLOT2=@SMA
  @PLOT3=@RSI

NEXT

![]() VT TRADER: HULL MOVING AVERAGE/RSI TRADING SYSTEM
VT TRADER: HULL MOVING AVERAGE/RSI TRADING SYSTEM
Our Traders’ Tip this month is based on “Trading Indexes With The Hull Moving Average” by Max Gardner in this issue.
In the article, Gardner describes a trading system based around the Hull moving average indicator. Gardner only discusses the conditions necessary to produce buy signals. We have interpreted and reversed the buy conditions so that our version of the system has the ability to generate potential buy signals and/or sell signals.
We’ll be offering our version of Gardner’s Hma/Rsi trading system for download in our client forums. The trading rules used by our version of the system are explained in the trading system’s Notes section.
To attach the trading system to a chart (Figure 17), select the “Add Trading System” option from the chart’s contextual menu, select “TASC - 12/2010 - Hull MA/RSI Trading System” from the trading systems list, and click the Add button.
The instructions for recreating the Hma/Rsi trading system in VT Trader are as follows:
- Ribbon→Technical Analysis menu→Trading Systems group→Trading Systems Builder command→[New] button
- In the General tab, type the following text for each field:
Name: TASC - 12/2010 - Hull MA / RSI Trading System
Short Name: tasc_HullMaIndexesSystem
Label Mask: 	TASC - 12/2010 - Hull MA / RSI Trading System
Short Hull MA (%shmaprice%,%shmalength%) = %ShortHMA%
Long Hull MA (%lhmaprice%,%lhmalength%) = %LongHMA%
RSI of Long Hull MA (%rsitpr%) = %RSIndex%
- In the Input Variable(s) tab, create the following variables:
[New] button... Name: maprice , Display Name: MA Price , Type: price , Default: close
[New] button... Name: maperiods , Display Name: MA Periods , Type: integer , Default: 50
[New] button... Name: shmaprice , Display Name: Short Hull MA Price , Type: price , Default: close
[New] button... Name: shmalength , Display Name: Short Hull MA Periods , Type: integer , Default: 4
[New] button... Name: lhmaprice , Display Name: Long Hull MA Price , Type: price , Default: close
[New] button... Name: lhmalength , Display Name: Long Hull MA Periods , Type: integer , Default: 9
[New] button... Name: rsitpr , Display Name: RSI Periods , Type: integer , Default: 9
[New] button... Name: TD , Display Name: Select Trades Allowed... , Type: Enumeration , Default:
 Bid (Click [...] button → [New] button → type Buy_Trades_Only; [New] button → type Sell_Trades_Only;
 [New] button → type Buy_and_Sell_Trades; [OK] button)
[New] button... Name: InitialStoplossMode , Display Name: Enable Stoploss Logic? , Type: Enumeration ,
 Default: Bid (Click [...] button → [New] button → type Yes; [New] button → type No; [OK] button)
[New] button... Name: SLP , Display Name: Stoploss Percentage , Type: float , Default: 5
[New] button... Name: ProfitTargetMode , Display Name: Enable Profit Target Logic? , Type: Enumeration ,
 Default: Bid (Click [...] button → [New] button → type Yes; [New] button → type No; [OK] button)
[New] button... Name: SLP , Display Name: Stoploss Percentage , Type: float , Default: 5
[New] button... Name: TPP , Display Name: Take Profit Perfectage , Type: float , Default: 15
- In the Output Variable(s) tab, create the following variables:
[New] button... Var Name: MA Name: MA * Checkmark: Indicator Output Select Indicator Output tab Line Color: purple Line Width: 2 Ling Style: solid Placement: Price Frame [OK] button... [New] button... Var Name: ShortHMA Name: Short HMA * Checkmark: Indicator Output Select Indicator Output tab Line Color: blue Line Width: 2 Ling Style: solid Placement: Price Frame [OK] button... [New] button... Var Name: LongHMA Name: Long HMA * Checkmark: Indicator Output Select Indicator Output tab Line Color: red Line Width: 2 Ling Style: solid Placement: Price Frame [OK] button... [New] button... Var Name: RSIndex Name: RSI * Checkmark: Indicator Output Select Indicator Output tab Line Color: green Line Width: 2 Ling Style: solid Placement: Additional Frame 1 [OK] button... [New] button... Var Name: RSIML Name: RSI 50-Level * Checkmark: Indicator Output Select Indicator Output tab Line Color: grey Line Width: 1 Ling Style: dashed Placement: Additional Frame 1 [OK] button... [New] button... Var Name: RSIOB Name: RSI 90-Level * Checkmark: Indicator Output Select Indicator Output tab Line Color: red Line Width: 1 Ling Style: dashed Placement: Additional Frame 1 [OK] button... [New] button... Var Name: RSIOS Name: RSI 10-Level * Checkmark: Indicator Output Select Indicator Output tab Line Color: red Line Width: 1 Ling Style: dashed Placement: Additional Frame 1 [OK] button... [New] button... Var Name: DisplayLongEntryInitialStop Name: Long Entry Stoploss * Checkmark: Indicator Output Select Indicator Output tab Line Color: blue Line Width: 2 Ling Style: solid Placement: Price Frame [OK] button... [New] button... Var Name: DisplayLongEntryProfitTarget Name: Long Entry Limit Profit Target * Checkmark: Indicator Output Select Indicator Output tab Line Color: dark blue Line Width: 2 Ling Style: solid Placement: Price Frame [OK] button... [New] button... Var Name: DisplayShortEntryInitialStop Name: Short Entry Stoploss * Checkmark: Indicator Output Select Indicator Output tab Line Color: red Line Width: 2 Ling Style: solid Placement: Price Frame [OK] button... [New] button... Var Name: DisplayShortEntryProfitTarget Name: Short Entry Limit Profit Target * Checkmark: Indicator Output Select Indicator Output tab Line Color: dark red Line Width: 2 Ling Style: solid Placement: Price Frame [OK] button... [New] button... Var Name: LongEntrySignal Name: Long Entry Signal * Checkmark: Graphic Enabled * Checkmark: Alerts Enabled Select Graphic Bookmark Font [...]: Up Arrow Size: Medium Color: Blue Symbol Position: Below price plot Select Alerts Bookmark Alert Message: Long Entry Signal Alert Sound: ringin.wav [OK] button... [New] button... Var Name: LongExitSignal Name: Long Exit Signal * Checkmark: Graphic Enabled * Checkmark: Alerts Enabled Select Graphic Bookmark Font [...]: Exit Sign Size: Medium Color: Blue Symbol Position: Above price plot Select Alerts Bookmark Alert Message: Long Exit Signal Alert Sound: ringin.wav [OK] button... [New] button... Var Name: ShortEntrySignal Name: Short Entry Signal * Checkmark: Graphic Enabled * Checkmark: Alerts Enabled Select Graphic Bookmark Font [...]: Down Arrow Size: Medium Color: Red Symbol Position: Above price plot Select Alerts Bookmark Alert Message: Short Entry Signal Alert Sound: ringin.wav [OK] button... [New] button... Var Name: ShortExitSignal Name: Short Exit Signal * Checkmark: Graphic Enabled * Checkmark: Alerts Enabled Select Graphic Bookmark Font [...]: Exit Sign Size: Medium Color: Red Symbol Position: Above price plot Select Alerts Bookmark Alert Message: Short Exit Signal Alert Sound: ringin.wav [OK] button... [New] button... Var Name: OpenBuy Name: Open Buy * Checkmark: Trading Enabled Select Trading Bookmark Trading Action: BUY Trader's Range: 10 [OK] button... [New] button... Var Name: CloseBuy Name: Close Buy * Checkmark: Trading Enabled Select Trading Bookmark Trading Action: SELL Trader's Range: 10 [OK] button... [New] button... Var Name: OpenSell Name: Open Sell * Checkmark: Trading Enabled Select Trading Bookmark Trading Action: SELL Trader's Range: 10 [OK] button... [New] button... Var Name: CloseSell Name: Close Sell * Checkmark: Trading Enabled Select Trading Bookmark Trading Action: BUY Trader's Range: 10 [OK] button... - In the Formula tab, copy and paste the following formula:
{Provided By: Capital Market Services, LLC & Visual Trading Systems, LLC} {Copyright: 2010} {Description: TASC, December 2010 - "Trading Indexes with the Hull Moving Average" by Max Gardner} {File: tasc_HullMaIndexesSystem.vttrs - Version 1.0} {Moving Average} MA:= mov(maprice,maperiods,S); {Short Hull Moving Average} ShortHMA_halvedLength:= if((ceiling(shmalength/2) - (shmalength/2) <= 0.5), ceiling(shmalength/2), floor(shmalength/2)); ShortHMA_sqrRootLength:= if((ceiling(sqrt(shmalength)) - sqrt(shmalength) <= 0.5), ceiling(sqrt(shmalength)), floor(sqrt(shmalength))); ShortHMA_Value1:= 2 * mov(shmaprice,ShortHMA_halvedLength,W); ShortHMA_Value2:= mov(shmaprice,shmalength,W); ShortHMA:= mov((ShortHMA_Value1-ShortHMA_Value2),ShortHMA_sqrRootLength,W); {Long Hull Moving Average} LongHMA_halvedLength:= if((ceiling(lhmalength/2) - (lhmalength/2) <= 0.5), ceiling(lhmalength/2), floor(lhmalength/2)); LongHMA_sqrRootLength:= if((ceiling(sqrt(lhmalength)) - sqrt(lhmalength) <= 0.5), ceiling(sqrt(lhmalength)), floor(sqrt(lhmalength))); LongHMA_Value1:= 2 * mov(lhmaprice,LongHMA_halvedLength,W); LongHMA_Value2:= mov(lhmaprice,lhmalength,W); LongHMA:= mov((LongHMA_Value1-LongHMA_Value2),LongHMA_sqrRootLength,W); {Relative Strength Index of Long Hull Moving Average} rsi_r:= (LongHMA - ref(LongHMA,-1)); rsi_rs:= Wilders(If(rsi_r>0,rsi_r,0),rsitpr) / Wilders(If(rsi_r<0,Abs(rsi_r),0),rsitpr); RSIndex:= 100-(100/(1+rsi_rs)); RSIML:= 50; RSIOB:= 90; RSIOS:= 10; {Define Final Trade Entry/Exit Criteria} LongEntryCond1:= C>MA; LongEntryCond2:= C>ref(C,-59); LongEntryCond3:= ShortHMA>ref(ShortHMA,-1); LongEntryCond4:= RSIndex>50; LongEntrySetup:= Cross((LongEntryCond1+LongEntryCond2+LongEntryCond3+LongEntryCond4),3.5); ShortEntryCond1:= C<MA; ShortEntryCond2:= C<ref(C,-59); ShortEntryCond3:= ShortHMA<ref(ShortHMA,-1); ShortEntryCond4:= RSIndex<50; ShortEntrySetup:= Cross((ShortEntryCond1+ShortEntryCond2+ShortEntryCond3+ShortEntryCond4),3.5); {Long Entry Signal} LongEntrySignal:= ((TD=0 OR TD=2) AND LongTradeAlert=0 AND ShortTradeAlert=0 AND LongEntrySetup=1); {Long Entry Price Simulated Data For Exit Options} LongEntryPrice:= valuewhen(1,LongEntrySignal=1,C); {Long Trade Stoploss} LongEntryInitialStop:= If(LongEntrySignal=1 OR LongTradeAlert=1, LongEntryPrice - valuewhen(1,LongEntrySignal=1,C*(SLP/100)), null); DisplayLongEntryInitialStop:= If(InitialStoplossMode=0, LongEntryInitialStop, null); {Long Trade Profit Target} LongEntryProfitTarget:= If(LongEntrySignal=1 OR LongTradeAlert=1, LongEntryPrice + valuewhen(1,LongEntrySignal=1,C*(TPP/100)), null); DisplayLongEntryProfitTarget:= If(ProfitTargetMode=0, LongEntryProfitTarget, null); {Long Exit Signal} LongExitSignal:= (LongTradeAlert=1 AND InitialStoplossMode=0 AND Cross(LongEntryInitialStop,C)) OR (LongTradeAlert=1 AND ProfitTargetMode=0 AND Cross(C,LongEntryProfitTarget)) OR (LongTradeAlert=1 AND Cross(RSIndex,90)); {Short Entry Signal} ShortEntrySignal:= ((TD=1 OR TD=2) AND ShortTradeAlert=0 AND LongTradeAlert=0 AND ShortEntrySetup=1); {Short Entry Price Simulated Data For Exit Options} ShortEntryPrice:= valuewhen(1,ShortEntrySignal=1,C); {Short Trade Stoploss} ShortEntryInitialStop:= If(ShortEntrySignal=1 OR ShortTradeAlert=1, ShortEntryPrice + valuewhen(1,ShortEntrySignal=1,C*(SLP/100)), null); DisplayShortEntryInitialStop:= If(InitialStoplossMode=0, ShortEntryInitialStop, null); {Short Trade Profit Target} ShortEntryProfitTarget:= If(ShortEntrySignal=1 OR ShortTradeAlert=1, ShortEntryPrice - valuewhen(1,ShortEntrySignal=1,C*(TPP/100)), null); DisplayShortEntryProfitTarget:= If(ProfitTargetMode=0, ShortEntryProfitTarget, null); {Short Exit Signal} ShortExitSignal:= (ShortTradeAlert=1 AND InitialStoplossMode=0 AND Cross(C,ShortEntryInitialStop)) OR (ShortTradeAlert=1 AND ProfitTargetMode=0 AND Cross(ShortEntryProfitTarget,C)) OR (ShortTradeAlert=1 AND Cross(10,RSIndex)); {Open Trade Determination for Long/Short EntryExit Signals} LongTradeAlert:= SignalFlag(LongEntrySignal,LongExitSignal); ShortTradeAlert:= SignalFlag(ShortEntrySignal,ShortExitSignal); {Create Auto-Trading Functionality; Only used in Auto-Trade Mode} OpenBuy:= LongEntrySignal=1 AND BuyPositionCount()=0; CloseBuy:= LongExitSignal=1 AND BuyPositionCount()>0; OpenSell:= ShortEntrySignal=1 AND SellPositionCount()=0; CloseSell:= ShortExitSignal=1 AND SellPositionCount()>0; - Click the “Save” icon to finish building the trading system.
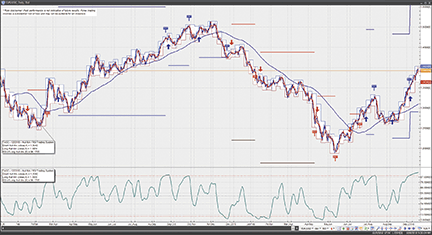
Figure 17: VT TRADER, HULL MOVING AVERAGE SYSTEM. Here is Max Gardner’s HMA/RSI trading system on a EUR/USD daily candlestick chart.
To learn more about VT Trader, please visit www.cmsfx.com.
![]() TRADING BLOX: HULL MOVING AVERAGE
TRADING BLOX: HULL MOVING AVERAGE
In “Trading Indexes With The Hull Moving Average” in this issue, author Max Gardner explains how to use the Hull moving average for long-term market timing.
This indicator can be implemented in Trading Blox using the following steps:
- Create a new Blox
- In it, define the parameters to drive the indicator periods: dsPeriod, hpDSPeriod, sqrtDSPeriod, rsiPeriod, smaPeriod, hmaPeriod, hmaHPeriod, hmasqrtPeriod, stopInATR, atrPeriod
- Define the indicators: dspWMA, dshpWMA, SMA, WMA, hWMA, averageTrueRange
- Define the instrument permanent variables: HMA, RSI_HMA, avgGain, avgLoss, MainHMA
- Define the indicator calculations in the “Update Indicators” script of the block:
'-------------------------------------------------------------------
'Trader's Tips December 2010
'Hull Moving Average System by Max Gardner
'Code by Jez Liberty - Au.Tra.Sy
'jez@automated-trading-system.com
'https://www.automated-trading-system.com/
VARIABLES: i TYPE: Integer

'Moving Average Calc
If Instrument.CurrentBar >= dsPeriod + sqrtDSPeriod Then

	'Calculate Hull Moving Average
	HMA = 0
	For i = 0 to sqrtDSPeriod - 1
	   HMA = HMA + (2*dshpWMA[i] - dspWMA[i])*(sqrtDSPeriod-i)
	Next
	HMA = HMA / (sqrtDSPeriod*(sqrtDSPeriod+1)/2)
EndIf

If Instrument.CurrentBar >= hmaPeriod + hmasqrtPeriod Then

	'Calculate Hull Moving Average
	MainHMA = 0
	For i = 0 to hmasqrtPeriod - 1
	    MainHMA = MainHMA + (2*WMA[i] - hWMA[i])*(hmasqrtPeriod-i)
	Next
	MainHMA = MainHMA / (hmasqrtPeriod*(hmasqrtPeriod+1)/2)
EndIf

'RSI Calc
If Instrument.CurrentBar = dsPeriod + sqrtDSPeriod + rsiPeriod Then

	'First calculation
	For i = 1 to rsiPeriod
	    If HMA[i]-HMA[i-1] > 0 Then
	    	avgGain = avgGain + HMA[i]-HMA[i-1]
	    Else
	    	avgLoss = avgLoss - (HMA[i]-HMA[i-1])
	    EndIf
	Next
	If avgLoss <> 0 Then
		RSI_HMA = 100/(1+avgGain/avgLoss)

	Else
		RSI_HMA = 0
	EndIf
EndIf

If Instrument.CurrentBar > dsPeriod + sqrtDSPeriod + rsiPeriod Then
	'Subsequent calculations
	If HMA-HMA[1] > 0 Then
		avgGain =((rsiPeriod-1)*avgGain + HMA-HMA[1])/rsiPeriod
	Else
		avgLoss =((rsiPeriod-1)*avgLoss - (HMA-HMA[1]))/rsiPeriod
	EndIf
	RSI_HMA = 100/(1+avgGain/avgLoss)
EndIf
'---------------------------------------------------------------------
- Define the entry logic in the Entry Orders block:
'------------------------------------------------------------------- 'Trader's Tips December 2010 'Hull Moving Average System by Max Gardner 'Code by Jez Liberty - Au.Tra.Sy 'jez@automated-trading-system.com 'https://www.automated-trading-system.com/ 'Open Long Position IF instrument.position <> LONG AND Instrument.Close > SMA AND MainHMA>MainHMA[1] AND RSI_HMA < 50 AND Instrument.Close>Instrument.Close[59] THEN broker.EnterLongOnOpen(Instrument.Close - (stopInATR * averageTrueRange)) ENDIF 'Open Short Position IF instrument.position <> SHORT AND Instrument.Close < SMA AND MainHMA<MainHMA[1] AND RSI_HMA > 50 AND Instrument.Close<Instrument.Close[59] THEN broker.EnterShortOnOpen(Instrument.Close + (stopInATR * averageTrueRange)) ENDIF '--------------------------------------------------------------------- - Define the exit logic in the Exit Orders block:
'-------------------------------------------------------------------
'Trader's Tips December 2010
'Hull Moving Average System by Max Gardner
'Code by Jez Liberty - Au.Tra.Sy
'jez@automated-trading-system.com
'https://www.automated-trading-system.com/

' If we are long
IF	instrument.position = LONG AND
	RSI_HMA > 90 THEN

	' Exit on the open
	broker.ExitAllUnitsOnOpen
ENDIF

' If we are short
IF	instrument.position = SHORT AND
	RSI_HMA < 10 THEN

	' Exit on the open
	broker.ExitAllUnitsOnOpen
ENDIF
'---------------------------------------------------------------------
This code can be downloaded from https://www.automated-trading-system.com/free-code/.
Figure 18 shows an example of the system used with the simple Fixed Fractional Money Manager risking 0.5% per trade on a diversified futures portfolio.
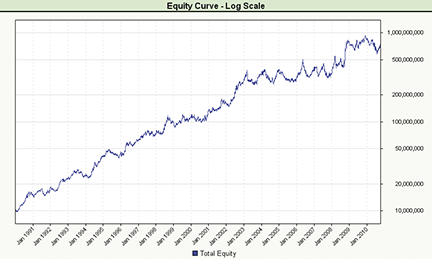
Figure 18: TRADING BLOX, HULL MOVING AVERAGE SYSTEM. This shows the system equity curve on a diversified portfolio of futures.

![]() TRADESIGNAL: HULL MOVING AVERAGE
TRADESIGNAL: HULL MOVING AVERAGE
The Hma/Rsi system presented by Max Gardner in his article in this issue, “Trading Indexes With The Hull Moving Average,” can be implemented using the free Interactive Online Charting Tool found at www.TradesignalOnline.com. In the tool, select New Strategy, paste the code into the online code editor, and save it. The strategy can now be added to any chart with a simple drag & drop (Figure 19).
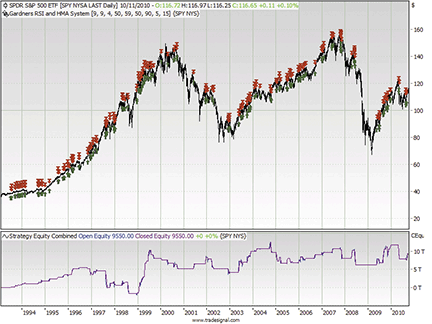
Figure 19: TRADESIGNAL, HULL MOVING AVERAGE SYSTEM. Max Gardner’s HMA/RSI system is shown on an SPY chart in Tradesignal Online.
The strategy is also available from the Lexicon section of www.TradesignalOnline.com, where it can be imported with a single click.
Meta:
       Subchart( False ),
       Synopsis("RSI and Hull MA Trading System, based on the 2010/12 Traders'
        Tips article in Technical Analysis of Stocks & Commodities, December 2010
         issue, by Gardner."),
       Weblink("https://www.tradesignalonline.com/lexicon/default.aspx?name=Gardners+RSI+and+HMA+System");

Inputs:
       RSI_Period( 9 , 1 ),
       RSI_HMA_Period( 9 , 1 ),
       HMA_Period( 4 , 1 ),
       SMA_Period( 50 , 1 ),
       Price_Displace( 59 , 1 ),
       RSI_Buy_Trigger( 50 , 1 ),
       RSI_Sell_Trigger( 90 , 1 ),
       Percent_Stop( 5.0 ),
       Percent_Target( 15.0 );

Vars:
       smaValue, rsiValue, rsiHmaValue, hmaValue,
       longSig, exitSig, numPositions, posEntry,
       stopValue, targetValue;

If CurrentBar = 1 Then
       SetStopContract;

smaValue = Average( Close, SMA_Period );
rsiHmaValue = Ind_HullMa( Close, RSI_HMA_Period );
rsiValue = RSI( rsiHmaValue, RSI_Period );
hmaValue = Ind_HullMa( Close, HMA_Period );

longSig = Close > smaValue And hmaValue > hmaValue[1] And rsiValue <= RSI_Buy_Trigger
 And Close > Close[Price_Displace];
exitSig = rsiValue >= RSI_Sell_Trigger;

numPositions = TotalPositions;
posEntry = numPositions > numPositions[1];

If posEntry Then
       Begin
             stopValue = ( Close * 0.01 ) * Percent_Stop;
             targetValue = ( Close * 0.01 ) * Percent_Target;
       End;

If MarketPosition = 1 Then
       Begin
             SetStopLoss( stopValue );
             SetStopProfitTarget( targetValue );
       End;

If longSig Then
       Buy("RSI HMA") Next Bar at Market;

If exitSig Then
       Sell("Exit") Next Bar at Market;

// *** Copyright tradesignal GmbH ***
// *** www.tradesignal.com ***
![]() SHARESCOPE: HULL MOVING AVERAGE
SHARESCOPE: HULL MOVING AVERAGE
The following Sharescope code displays entry and exit signals on a chart according to Max Gardner’s Hull moving average trading strategy. This implementation is for end-of-day traders but can be easily adapted for real-time. The price bars, candles, or line plot will be colored blue for the duration of the trade. The code in our script library (www.sharescript.co.uk) includes a dialog for configuring the variables.
A sample chart is shown in Figure 20.
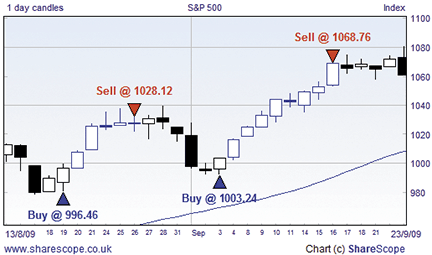
Figure 20: SHARESCOPE, HULL MOVING AVERAGE SYSTEM
//@Name:Hull MA
//@Description:Displays entry and exit signals on a graph according to a trading system
 using the Hull Moving Average as described by Max Gardner in the December 2010 issue of
  Stocks & Commodities magazine.

 function onNewChart()
{
    var ma1 = new MA(Math.round(4/2),MA.Weighted);
    var ma2 = new MA(4,MA.Weighted);
    var ma3 = new MA(Math.round(Math.sqrt(4)),MA.Weighted);
    var ma4 = new MA(Math.round(9/2),MA.Weighted);
    var ma5 = new MA(9,MA.Weighted);
    var ma6 = new MA(Math.round(Math.sqrt(9)),MA.Weighted);
    var ma7 = new MA(50);
    var rsi1 = new RSI(4);
    var sma = []
    var hullMA1 = [];
    var hullMA2 = [];
    var hullRSI = [];
    var posOpen;
    var openPrice;
    var hh;

    for (var i=0;i<bars.length;i++)
    {
        bars[i].colour = Colour.Black;
        hullMA1[i] = ma3.getNext(2*ma1.getNext(bars[i].close)-ma2.getNext(bars[i].close));
        hullMA2[i] = ma6.getNext(2*ma4.getNext(bars[i].close)-ma5.getNext(bars[i].close));
        hullRSI[i] = rsi1.getNext(hullMA2[i]);
        sma[i] = ma7.getNext(bars[i].close);
        if (i<59) continue;
        if (posOpen)
        {
            bars[i].colour = Colour.Blue;
            if (bars[i].close > hh) hh=bars[i].close;
            if (hullRSI[i]>90 || bars[i].close/openPrice>1.15 || 1-bars[i].close/hh>0.05)
            {
                posOpen = false;
                setBrushColour(Colour.Red);
                setFontStyle("Arial",10,Colour.Red);
                drawSymbol(i, bars[i].high, Symbol.TriangleDown, "",
                 BoxAlign.Centre|BoxAlign.Above);
                setBrushColour(Colour.White);
                drawText(i, bars[i].high+(bars[i].high*0.01),"Sell
                 @ "+bars[i].close.toFixed(2),BoxAlign.Centre|BoxAlign.Above,
                 TextAlign.Centre);
            }
        }
        if (!posOpen && bars[i].close>sma[i] &&
         hullMA1[i-1]<hullMA1[i-2] && hullMA1[i]>hullMA1[i-1]
&& hullRSI[i]<50 && bars[i].close>bars[i-59].close)
        {
            posOpen = true;
            hh = bars[i].close;
            openPrice = bars[i].close;
            setBrushColour(Colour.Blue);
            setFontStyle("Arial",10,Colour.Blue);
            drawSymbol(i, bars[i].low, Symbol.TriangleUp, "",
             BoxAlign.Centre|BoxAlign.Below);
            setBrushColour(Colour.White);
            drawText(i, bars[i].low-(bars[i].low*0.01),"Buy @ "+bars[i].close.toFixed(2),
             BoxAlign.Centre|BoxAlign.Below,
            TextAlign.Centre);
        }
    }
}

![]() CHARTSY: HULL MOVING AVERAGE
CHARTSY: HULL MOVING AVERAGE
For Windows + Mac + Linux
The Hull moving average calculation described in the article by Max Gardner in this issue (“Trading Indexes With The Hull Moving Average”) is available in Chartsy in the “Hull moving average overlay” plugin and in the “relative strength index” indicator plugin. To install these plugins, please go to Tools→Plugins→Available Plugins. These plugins are preinstalled in Chartsy v1.4.
You can find the Java source code for the Hma calculation here.
A sample chart implementation is shown in Figure 21.
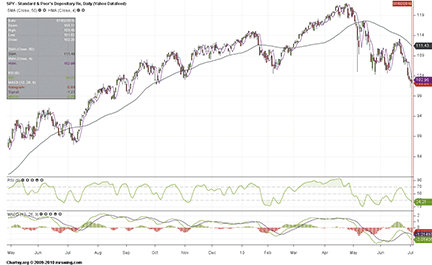
Figure 21: CHARTSY, HULL MOVING AVERAGE SYSTEM. This sample chart shows the RSI 9 of HMA(9) as an indicator, and the HMA(4) and SMA(50) as overlays.
To download Chartsy, discuss these tools, and help us develop other tools, please visit our forum at www.chartsy.org. Our development staff will be happy to assist and you can become a Chartsy contributor yourself.
![]() MICROSOFT EXCEL: HULL MOVING AVERAGE
MICROSOFT EXCEL: HULL MOVING AVERAGE
This Traders’ Tip describes how to implement Max Gardner’s Hull moving average (Hma) strategy in Microsoft Excel.
This spreadsheet performs buy and sell signal calculations and plots buy and sell markers.
The spreadsheet is provided here as a working downloadable Excel file (updated 12/16/2010), but step-by-step instructions for building the spreadsheet from scratch are also provided below.
First, here are some development notes:
- Microsoft Excel does not have built-in functions to calculate either Rsi or weighted moving averages, but they can be built from Excel’s formula-building blocks.
- This spreadsheet makes extensive use of the Excel built-in function “Offset” to allow the user to dynamically control the lookback lengths of the derived Rsi, Wma, and ultimately the Hull moving average (Hma).
- The end-of-day data used to build this example was downloaded from the Historical Prices page at finance.yahoo.com. This downloads as a .Csv formatted file. Up to seven years of end-of-day history may be available for a given symbol. As downloaded, the data in the .Csv file is in date-descending sequence, which places the most current day at the top of the spreadsheet. The formulas used in this spreadsheet depend on this date-descending sequence.
- If you chart prices, Hma, or other data, be sure to format the x-axis and select the “categories in reverse order” checkbox to get your dates and data to plot left to right.
- To avoid weekend and holiday gaps on charts, I prefer to have Excel plot the x-axis as categories and not as dates.
- In the cell formula specifications given below, the large bold text should be typed into the indicated cell.
- Save your work frequently.
Here are step-by-step instructions for building the Excel worksheet:
- Get some data into a blank spreadsheet. Opening a downloaded .CSV file is one way. (Suggested minimum of 375 days, but suit yourself!) Regardless of source, organize your data in Date-Descending Sequence, with Date in column A, Volume in column B, Open in column C, High in column D, Low in Column E, and Close in column F.
- Initial worksheet formatting: Insert blank rows at the top so that the first price data row is Row 10 and your column headers are in Row 9. We will be using this extra white space at the top for Formula Control values and Descriptions. I like to place a split bar under the headers (row 9) and freeze frames so that the headers remain visible as I scroll through the data.
- Use “Save As” to save your results with the .XLS (or .XLSX) suffix. I suggest that you include the stock or index symbol in the file name.
- Cell A1: Enter the stock or index symbol. Cell B1: Enter the full name of the stock or index.
- Cell A4: Enter Avail Rows
- Cell A5: Enter =COUNT(A10:A5000). This will calculate how many price rows are available on your worksheet. A full seven years comes in around 4500 days, so 5000 should be large enough to envelope what you actually have on hand.
- Cell A6: Enter LastRow. Cell A7: =ROW(A9)+A5 to calculate last actual data row. We will use this value in the trading system formulas to determine relative row 70, our “starting” row. Bypassing the first 70 rows of data before we start the trading system calculations accommodates the 59-day lookback used in Max Gardner’s system and allows an additional 10 days for the various moving averages to stabilize before this system will try to buy or sell stuff.
- Cell G7: Moving Ave, G8: Weights, G9: Stick, G10: =G11+1
- H4: Calculate First HMA using Close along with RSI of First HMA
- H5: Period:, I5: 9, Make cell I5 bold and blue. It is a user input control point.
- J5: Period / 2:, K5: =INT(I5/2), L5: SQRT(Period):, M5: =INT(SQRT(I5))
- H6: HMA, H7: ="SLOW ("&I5&")", H8: WMA, H9: of Close
- H10: =SUMPRODUCT(OFFSET($F10,0,0,I$5,1),OFFSET($G$10,$G$10-I$5,0,I$5,1))/SUM(OFFSET($G$10,$G$10-I$5,0,I$5,1)). This formula uses OFFSET to select a vertical stick of closing prices I5 tall and multiply it by an OFFSET selected stick of weights (column G) I5 tall starting I5 cells above the last available cell. This summed product is then divided by the sum of the OFFSET selected stick of weights to give the weighted average. (This will make more sense if you look at it after step 78.)
- I7: ="FAST ("&K5&")", I8: WMA, I9: of Close
- I10: =SUMPRODUCT(OFFSET($F10,0,0,K$5,1),OFFSET($G$10,$G$10-K$5,0,K$5,1))/SUM(OFFSET($G$10,$G$10-K$5,0,K$5,1))
- J8: Intermediate, J9: Result, J10: =2*I10-H10
- K8: ="HMA("&I5&")", K9: of Close
- K10: =SUMPRODUCT(OFFSET(J10,0,0,M$5,1),OFFSET($G$10,$G$10-M$5,0,M$5,1))/SUM(OFFSET($G$10,$G$10-M$5,0,M$5,1))
Setup for the RSI of the first HMA.
- L6: RSI of HMA, L8: 1 Bar Delta, L9: =K8, L10: =K10-K11
- M8: =O7&" Bar UP", M9: Sum
- M10: =SUMIF(OFFSET(L10,0,0,O$7,1),">0.00",OFFSET(K10,0,0,O$7,1)) Sum those HMA values where the delta is greater than zero.
- N8: =O7&" Bar DWN", N9: Sum
- N10: =SUMIF(OFFSET(L10,0,0,O$7,1),"<0.00",OFFSET(K10,0,0,O$7,1)) Sum those HMA values where the delta is less than zero.
- O7: 9. Make cell O7 bold and blue. It is a user input control point.
- O8: Bar RSI of, O9: =L8, O10: =100*M10/(M10+N10)
- Place an outside border around cells H4:O9. Place an outside border around cells H6:K9. Place an outside border around cells L6:O9.
Now to set up for the second HMA calculation: To simplify things, we can copy what we have just done. Appropriate use of “$” in the formulas created to this point will lock row and column references as appropriate to keep things straight when we copy the existing block of HMA formulas and controls.
- Select cells H4:O10. Right-click in the selected area. In the dropdown, click on “COPY.” Right-click on cell P4. In the dropdown, click on “PASTE.” Now columns P through W should look like columns H through O.
Next alter the header and user control values for the second HMA calculation.
- Replace the contents of P4: Calculate Second HMA using Close along with RSI of Second HMA
- Replace Q5: 4, Replace W7: 6
Additional inputs for the buy and sell system logic are as follows:
- X7: 9. Make cell X7 bold and blue. It is a user input control point.
- X8: Bar SMA, X9: of Close, X10: =AVERAGE(OFFSET($F10,0,0,X$7,1))
- Y7: 50. Make cell Y7 bold and blue. It is a user input control point.
- Y8: Bar SMA, Y9: of Close, Y10: =AVERAGE(OFFSET($F10,0,0,Y$7,1))
Buy signal calculations:
- Z3: Buy Signal Logic, Z5: Buy Rules
- Z8: Close >, Z9: ="SMA("&Y7&")", Z10: =F10>Y10
- AA8: =S8, AA9: Turn Up, AA10: =AND(T10>T11,T11<T12)
- AB6: Prev Day, AB7: ="RSI("&O7&") of", AB8: =K8, AB9: ="<= 50"
- AB10: =O11<=50
- AC7: Close >, AC8: 59 Days, AC9: Ago, AC10: =F10>OFFSET(F10,59,0,1,1)
- AD3: Buy, AD4: Signals, AD5: =COUNTIF(OFFSET(AD10,0,0,$A$5,1),TRUE)
- AD7: Buy, AD8: Decision, AD9: Flag
- AD10: =AND(Z10,AA10,AB10,AC10,ROW()<=$A$7-$AH$4)
- Place an outside border around cells Z3:AD9. Place an outside border around cells Z5:AC5. Place an outside border around cells Z6:AC9. Place an outside border around cells AD3:AD9.
Trading model block:
- AF3: One Symbol Trading Model, AG4: Start Trading @ Bar:. Right-align AG4
- AH4: 70. Make cell AH4 bold and blue. It is a user input control point.
- AI4: =A7-AH4, AG5: System Activity. Center AG5.
- AE8: Active, AE9: Position,
- AE10: =AND(OR(AND(NOT(AE11),AD10),AE11),NOT(AO10))
- AF8: Buy @, AF9: Price
- AF10: =IF(AND(AE10,NOT(AE11)),C10,IF(AND(AE12,NOT(AE11)),0,AF11))
- AG8: Sell @, AG9: Price, AG10: =IF(AND(AF10=0,AF11>0),C10,0)
- AG6: Min:, AG7: Max:. Right align AG6, AG7.
- AH6: =MIN(OFFSET(AH10,0,0,$A$5,1)), AH7: =MAX(OFFSET(AH10,0,0,$A$5,1))
- AH8: Transaction, AH9: Net, AH10: =IF(AG10>0,AG10-AF11,0)
- AI6: =MIN(OFFSET(AI10,0,0,$A$5,1)), AI7: =MAX(OFFSET(AI10,0,0,$A$5,1))
- AI8: Running, AI9: Equity, AI10: =AI11+AH10
- Place an outside border around cells AE2:AI9. Place an outside border around cells AE5:AI5.
Sell signal calculations:
- AJ3: Sell Signal Logic, AJ5: Sell Rules
- AJ7: ="RSI("&O7&") of", AJ8: =K8, AJ9: >= 90, AJ10: =O10>=90
- AK6: 5%. Make cell AK6 bold and blue. It is a user input control point.
- AK7: Stop, AK8: Loss, AK9: Target AK10: =AF11*(1-$AK$6)
- AL6: Hit, AL7: Stop, AL8: Loss, AL9: Target AL10: =F10<AK10
- AM6: 15%. Make cell AM6 bold and blue. It is a user input control point.
- AM8: Profit, AM9: Target, AM10: =AF11*(1+$AM$6)
- AN7: Hit, AN8: Profit, AN9: Target, AN10: =F10>AM10
- AO3: Sell, AO4: Signals, AO5: =COUNTIF(OFFSET(AO10,0,0,$A$5,1),TRUE)
- AO7: Sell, AO8: Decision, AO9: Flag
- AO10: =AND(NOT(ISBLANK(AE11)),AE11,OR(AJ10,AL10,AN10))
- Place an outside border around cells AJ3:AO9. Place an outside border around cells AO3:AO9. Place an outside border around cells AJ5:AN5. Place an outside border around cells AJ3:AN9.
Setup to plot buy and sell markers: When you plot these on a price chart, format the data series with no lines and an 8-pt, filled-in circle marker. Green for buy, red for sell….
- AP8: Plot, AP9: Buy
- AP10: =IF(AND(AD10,NOT(AE11),NOT(ISBLANK(AE11))),AF10,0)
- AQ9: Plot, AQ9: Sell
- AQ10: =IF(AND(NOT(ISBLANK(AE12)),AE12,AO11),AG10,0)
Final steps:
Propagate the formulas you have built in rows 10 to 11 and on down through your last price data row using shortcuts for area selection, copy, and paste.
- In the upper left of the Excel window at the left end of the Formula Bar is a field that reflects the location of the currently selected cell. To verify that you are looking at the correct field, click on cell A1 and then click on cell C3. This field should change each time to reflect the selected cell name. You may use this field to quickly make small or large area selections without a lot of click/hold/drag mouse work.
- To select cells G10:AQ10, left-click in the field we located in step 74. Type G10:AQ10 and press enter. These cells will be highlighted.
- Hold down CTRL and type a lower case c (ctrl-c) to copy these cells. The border of the selected area will change to flashing dashes to confirm the copy in progress.
- Once again, left-click in the field we located in step 74. Type G11:AQ followed by the “Last Row” number showing in cell A7 (My A7 shows 384, so I typed G11:AQ384). Press enter to select this target area.
- Hold down CTRL and type a lower case v (ctrl-v) to paste the copied formulas into the selected target area.
Be sure to save your completed spreadsheet before you start making charts. A sample chart is shown in Figure 22.
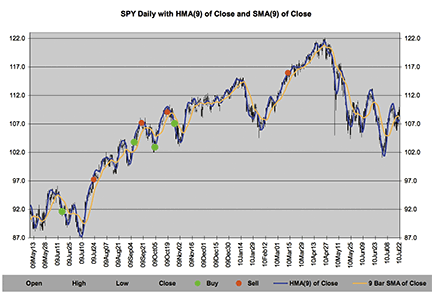
CHART OF SPY WITH TRADES

![]() WEALTH-LAB: HULL MOVING AVERAGE — GARDNER ARTICLE CODE
WEALTH-LAB: HULL MOVING AVERAGE — GARDNER ARTICLE CODE
Moving averages are often the best way to eliminate data spikes, and those of relatively long lengths smooth data as well. However, moving averages have a major flaw, in that their long lookback periods introduce lag. The solution is to modify the moving average formula and remove the lag.
WEALTH-LAB CODE FOR RSI AND HMA SYSTEM

var  HMA : integer;

var ps: float;
var NRSIPANE, BAR: integer;
{ Create pane for RSI}
nRSIPane := CreatePane( 100, TRUE, FALSE );
{ Plot RSI}
PlotSeries( RSISeries( HMASeries(#close, 9), 9 ), nRSIPane, 035, 2 );
DrawHorzLine( 20, nRSIPane, 040, 1 );
DrawHorzLine(45, nRSIPane, 040, 1 );
DrawHorzLine( 50, nRSIPane, 888, 1 );
DrawText( 'RSI 9 day’, nRSIPane, 4, 4, 035, 8 );

{RSI with HMA System}

{StopLoss and Profit Target}
InstallStopLoss(5.0);
InstallProfitTarget(15);

for Bar := 70 to BarCount() - 1 do
Begin
	ApplyAutoStops(Bar);
	if LastPositionActive() then
	Begin
	{ Sell Rules }
	if RSI( Bar,HMASeries(#close, 9) , 9 ) >= 90 then
	SellAtMarket( Bar + 1, PositionCount() - 1, '');
	end
	else
		Begin
		{Buy Rules }
		if PriceClose(Bar) >  SMA( Bar, #Close, 50 ) then
		if TurnUp(Bar,HMASeries(#close, 4)) then
		if RSI( Bar - 1, HMASeries(#close, 9), 9 ) <=50 then
		if (PriceClose(Bar) > PriceClose(Bar - 59)) then
			Begin
			BuyAtMarket(Bar + 1, '');
			SetPositionData( LastPosition, -(RSI( Bar-1, HMASeries(#close, 9), 9 )) );
			end;
		end;
end;

function HMASeries(Series, Period: integer): integer;
Begin
  var Name : string = 'HMA(' + GetDescription(Series) + ',' + IntToStr(Period) + ')';
  Result:= FindNamedSeries(Name);
  if Result >= 0 then exit;
  var SlowWMA: integer = WMASeries(Series, Period);
  var FastWMA: integer = WMASeries(Series, Period div 2);
  Result := AddSeries(FastWMA, SubtractSeries(FastWMA, SlowWMA));
  Result := WMASeries(Result, trunc(sqrt(Period)));
  SetDescription(Result, Name);
end;