TRADING SYSTEMS
Working Two Stop Levels
Combining Rsi With Rsi 
Optimization and stop-losses can help you minimize risks and give you better returns.
You would like to be long in a market that’s trending up, but what about when the trend turns down? Do you exit and just watch from the sidelines, or do you try to trade on the corrections in the downtrend? Here’s a simple combination where you can trade long-term uptrends and short-term corrections, all in one chart.
One of my previous strategies didn’t allow me to enter a trade and stay there in a long and strong uptrend, since the strategy was designed to use the relative strength index (Rsi) on a daily basis. The total return from my Rsi strategy was fair, but there were many trades with little return, especially in volatile markets.
I decided to build a new strategy with these requirements:
- The strategy should be based on a single model or indicator to keep it as simple and transparent as possible.
- It should be designed for weekly trading. I have a full-time job and can only spend time analyzing stocks on the weekends.
- The need for subjective analysis of charts and formations — such as support lines, channels, and so forth — should be kept to a minimum.
- The strategy should be designed to stay long in an uptrend but also trade on the corrections in a downtrend.
- Its implementation should be fairly simple.
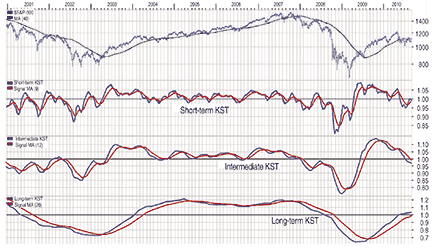
Technician Martin Pring’s Kst (“know sure thing”) indicator comes in three different setups — short term, intermediate term, and long term — and is designed for weekly data. The three setups try to model the market waves of three different periods where short term is between three and six weeks, intermediate term is between six weeks and nine months, and the long-term trend is between six months and three years. Figure 1 shows a bar chart of the Standard & Poor’s 500 and the three Kst indicators.

Figure 1: one price chart, one indicator, and three time frames. Here you see the KST indicator applied to the S&P 500 from 2001 to 2010.