TRADING TECHNIQUES
History Repeats Itself, But When?
Chart Analog Scenarios
Technical analysis is based on the theory that history will repeat itself. What is not so obvious, however, is that these historical repetitions may happen not just over a few months but over a few decades. This is where chart analogs can be of great value.
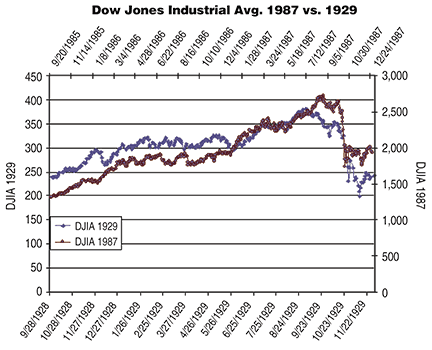
Chart analogs compare a market’s price action over two different periods of time to discern similar technical patterns that may repeat. Analogs, which are easy to create, have been significantly useful with comparisons such as the 1929 versus 1987 stock market crashes.
Defining chart analogs
As noted in Edwin LeFèvre’s Reminiscences Of A Stock Operator, “Nowhere does history indulge in repetitions so often or so uniformly as in Wall Street.” Indeed, many stock chart patterns spanning significant time periods repeat throughout history. The most famous example of this is the 1987 US stock market crash having had so many similarities to the market crash of 1929. The correlation of the price action between these two crashes is remarkably high.
Such comparisons are referred to as chart analogs, as they compare a current market’s price action (or one period in time) to a different past period of price action that is significantly correlated. The main purpose of chart analogs is to forecast future prices based on history repeating itself. These forecasts are of particular interest near market tops and bottoms.
Chart analogs do not get as much credit or coverage as they deserve. This is especially true given how easy and quick they are to use. Similar to all technical tools, however, chart analogs are fallible and can break down. Nevertheless, they are a valuable tool in building future market scenarios.

Figure 1: 1929 vs. 1987 Us stock market crashes. Note how similar the price action is between these two periods.