FOREX FOCUS
Trading Time Frames
Channels In The Forex Markets
This trading setup will stop you from being shaken out of your positions in any time frame.
The foreign exchange markets are an arena of competing forces constantly in conflict with each other. The markets are torn apart by worry, uncertainty, doubt, fear and greed, not to mention profit. As a consequence, many traders get shaken out of their positions by a short-term wave of opposing news. Even when a position is showing a profit, there is never a certainty that the market will continue in the anticipated direction and there is almost the same sense of relief when getting out of a good position as in liquidating a bad one. As a result, many traders tend to play a zero-sum game. When they see a profit, they take it. When they see a loss, they run it.
A successful trader must trade from a known plan — one that not only supports the direction of the position in the market but also helps to remain confident in the original decision. In this article I’ll demonstrate that if used properly, technical chart analysis can be accurate and profitable, especially in a trending market.
A trending market
A trending market is where the best percentage trades are to be found, but catching the trend is easier said than done. Many traders will spend their time looking for a reversal instead of remaining with the trend by simply working from one side of the market — that is, the buy side in a bull trend or the sell side in a bear trend until the trend is over.

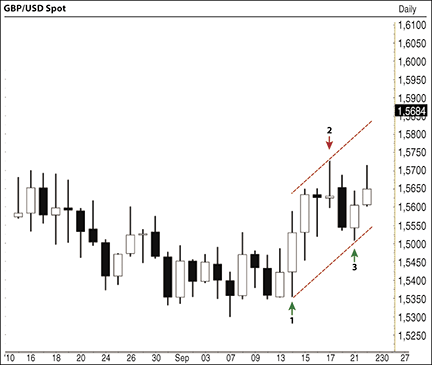
Figure 1: gbp/usd weekly chart with three reaction points. The potential beginning of a trend channel with three reaction points is the criteria for establishing the channel trendlines in both bullish or bearish markets on any time frame.