TRADERS’ TIPS
March 2011
Here is this month’s selection of Traders’ Tips, contributed by various developers of technical analysis software to help readers more easily implement some of the strategies presented in this and other issues.
Other code appearing in articles in this issue is posted in the Subscriber Area of our website at https://technical.traders.com/sub/sublogin.asp. Login requires your last name and subscription number (from mailing label). Once logged in, scroll down to beneath the “Optimized trading systems” area until you see “Code from articles.” From there, code can be copied and pasted into the appropriate technical analysis program so that no retyping of code is required for subscribers.
You can copy these formulas and programs for easy use in your spreadsheet or analysis software. Simply “select” the desired text by highlighting as you would in any word processing program, then use your standard key command for copy or choose “copy” from the browser menu. The copied text can then be “pasted” into any open spreadsheet or other software by selecting an insertion point and executing a paste command. By toggling back and forth between an application window and the open web page, data can be transferred with ease.
This month’s tips include formulas and programs for:
- TRADESTATION: THREE-BAR INSIDE BAR PATTERN
- THINKORSWIM.COM: THREE-BAR INSIDE BAR PATTERN
- METASTOCK: THREE-BAR INSIDE BAR PATTERN
- eSIGNAL: THREE-BAR INSIDE BAR PATTERN
- WEALTH-LAB: THREE-BAR INSIDE BAR PATTERN
- AMIBROKER: THREE-BAR INSIDE BAR PATTERN
- WORDEN BROTHERS TC2000: THREE-BAR INSIDE BAR PATTERN
- NEUROSHELL TRADER: THREE-BAR INSIDE BAR PATTERN
- AIQ: THREE-BAR INSIDE BAR PATTERN
- TRADERSSTUDIO: THREE-BAR INSIDE BAR PATTERN
- TRADECISION: THREE-BAR INSIDE BAR PATTERN
- WAVE59: THREE-BAR INSIDE BAR PATTERN
- NINJATRADER: THREE-BAR INSIDE BAR PATTERN
- NEOTICKER: THREE-BAR INSIDE BAR PATTERN
- TRADE NAVIGATOR: THREE-BAR INSIDE BAR PATTERN
- UPDATA: THREE-BAR INSIDE PATTERN
- TRADESIGNAL: THREE-BAR INSIDE BAR PATTERN
- TRADINGSOLUTIONS: THREE-BAR INSIDE BAR PATTERN
- SHARESCOPE: THREE-BAR INSIDE BAR PATTERN
- VT TRADER: THREE-BAR INSIDE BAR PATTERN TRADING SYSTEM
- TRADING BLOX: THREE-BAR INSIDE BAR PATTERN
- MICROSOFT EXCEL: THREE-BAR INSIDE BAR STUDY
- EASYLANGUAGE — PRATHAP ARTICLE CODE

TRADESTATION: THREE-BAR INSIDE BAR PATTERN
In “Three-Bar Inside Bar Pattern” in this issue, author Johnan Prathap describes a three-bar setup that includes a comparison of closing prices and an inside bar as the second bar of the three-bar pattern. The author suggests a setup for a short entry and a setup for a long entry, as described in the article.
Here, we present the EasyLanguage code for 1) the strategy as described in Prathap’s article; 2) a charting indicator showing long and short setups; and 3) a RadarScreen indicator also showing long and short setups. Both indicators include an alert to notify the user when a setup has occurred.
To download the EasyLanguage code for the strategy and the two indicators, go to the TradeStation and EasyLanguage Support Forum (https://www.tradestation.com/Discussions/forum.aspx?Forum_ID=213) and search for the file “_3Bar_InsideBar.eld.”
A sample chart is shown in Figure 1.
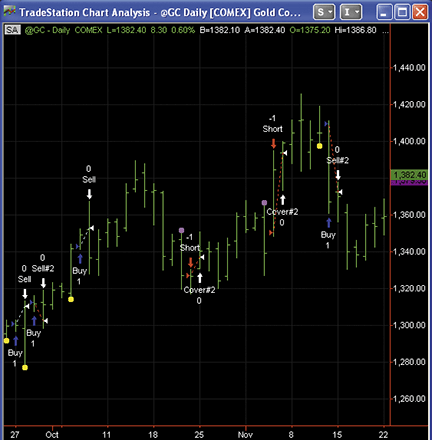
Figure 1: TRADESTATION, Three-Bar Inside Bar Pattern. Shown here is a daily chart of a gold futures continuous contract displaying Johnan Prathap’s three-bar setup strategy. The yellow markers are long setups per Prathap’s article and the magenta markers are short setups per the article.
 EasyLanguage code for TradeStation


 _3Bar_InsideBarStrat (Strategy)

inputs:
	Tr( 0.75 ),
	Sl( 0.75 ) ;

variables:
	MP( 0 ),
	EP( 0 ) ;

Condition1 = Close > Close[1] ;
Condition2 = High < High[1] and Low > Low[1] ;
Condition3 = Close < Close[1] ;

MP = MarketPosition ;
EP = EntryPrice ;

if MP = 0 then
	begin
	if Condition1 and Condition2[1]
	 and Condition1[2] then
		Buy next bar market ;
	if Condition3 and Condition2[1]
	 and Condition3[2] then
		SellShort next bar market ;
	end ;

if MP = 1 then
	begin
	Sell next bar EP + ( EP * Tr / 100 ) Limit ;
	Sell next bar EP - ( EP * Sl / 100 ) Stop ;
	end ;

if MP = -1 then
	begin
	BuytoCover next bar EP - ( EP * Tr / 100 ) Limit ;
	BuytoCover next bar EP + ( EP * Sl / 100 ) Stop ;
	end ;

_3Bar_InsideBar (Chart Indicator)

inputs:
	MarkerOffsetTicks( 5 ) ;

variables:
	intrabarpersist Offset( 0 ) ;

once
	Offset = MarkerOffsetTicks * MinMove/PriceScale ;

Condition1 = Close > Close[1] ;
Condition2 = High < High[1] and Low > Low[1] ;
Condition3 = Close < Close[1] ;

if Condition1 and Condition2[1] and Condition1[2] then
	begin
	Alert( "3-Bar InsideBar Long Setup" ) ;
	Plot1( L - Offset ) ;
	SetPlotColor( 1, Yellow ) ;
	end
else if Condition3 and Condition2[1]
 and Condition3[2] then
	begin
	Alert( "3-Bar InsideBar Short Setup" ) ;
	Plot1( H + Offset ) ;
	SetPlotColor( 1, Magenta ) ;
	end
else
	NoPlot( 1 ) ;


_3Bar_InsideBarRS (RadarScreen Indicator)

Condition1 = Close > Close[1] ;
Condition2 = High < High[1] and Low > Low[1] ;
Condition3 = Close < Close[1] ;

if Condition1 and Condition2[1] and Condition1[2] then
	begin
	Alert( "3-Bar InsideBar Long Setup" ) ;
	Plot1( "Long S/U", "Setup" ) ;
	SetPlotColor( 1, Black ) ;
	SetPlotBGColor( 1, Green ) ;
	end ;

if Condition3 and Condition2[1] and Condition3[2] then
	begin
	Alert( "3-Bar InsideBar Short Setup" ) ;
	Plot1( "Short S/U", "SETUP" ) ;
	SetPlotColor( 1, White ) ;
	SetPlotBGColor( 1, Red ) ;
	end ;

Plot2( Close, "Close" ) ;
This article is for informational purposes. No type of trading or investment recommendation, advice, or strategy is being made, given, or in any manner provided by TradeStation Securities or its affiliates.

THINKORSWIM.COM: THREE-BAR INSIDE BAR PATTERN
In “Three-Bar Inside Bar Pattern” in this issue, Johnan Prathap describes a trading strategy derived from the inside bar candle formation. The strategy utilizes both long and short entries coupled with a predefined risk-management technique.
We have created four strategy files utilizing our proprietary programming language, thinkScript. When applied together, they will provide the signals generated by Prathap’s methodology (Figure 2).
You can download the code for this strategy from the thinkorswim website at the following link: https://mediaserver.thinkorswim.com/transcripts/2011/thinkorswim.zip. The code is also shown below along with instructions for applying it.
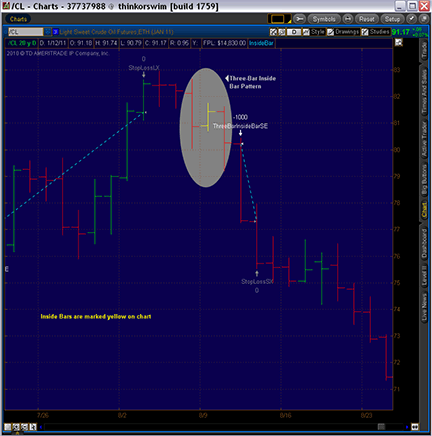
Figure 2: THINKORSWIM, Three-Bar Inside Bar Pattern. This thinkorswim chart demonstrates Johnan Prathap’s three-bar inside bar pattern trading system on daily crude oil. The inside bars are marked in yellow on the chart.
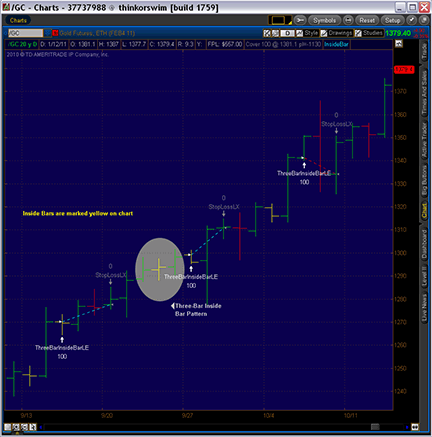
Figure 3: THINKORSWIM, Three-Bar Inside Bar Pattern. This thinkorswim chart demonstrates Johnan Prathap’s three-bar inside bar pattern trading system on gold futures. The inside bars are marked in yellow on the chart.
- From our TOS Charts, Select Studies → Edit Studies
- Select the “Strategies” tab in the upper left-hand corner.
- Select “New” in the lower left-hand corner.
- Name the long entry (i.e., ThreeBarInsideLE)
- Click in the script editor window, remove “declare LONG_ENTRY,” and paste in the following:
# Three-Bar Inside Bar LE declare LONG_ENTRY; addOrder( close > close[1] and high[1] < high[2] and low[1] > low[2] and close[2] > close[3] and IsNaN(entryPrice()) ); SetColor(GetColor(9)); - Select OK.
- Select “New” in the lower left-hand corner.
- Name the short entry (i.e., ThreeBarInsideSE)
- Click in the script editor window, remove “declare LONG_ENTRY,” and paste in the following:
# Three-Bar Inside Bar SE declare SHORT_ENTRY; addOrder( close < close[1] and high[1] < high[2] and low[1] > low[2] and close[2] < close[3] and IsNaN(entryPrice()) ); SetColor(GetColor(9)); - Select OK.
- Select “New” in the lower left-hand corner.
- Name the long exit (i.e., ThreeBarInsideLX)
- Click in the script editor window, remove “declare LONG_ENTRY,” and paste in the following:
# Three-Bar Inside Bar LX declare LONG_EXIT; input offsetType = {default percent, value, tick}; input target = 0.75; input stop = 0.75; def entryPrice = entryPrice(); def mult; switch (offsetType) { case percent: mult = entryPrice / 100; case value: mult = 1; case tick: mult = tickSize(); } def targetPrice = entryPrice + target * mult; def stopPrice = entryPrice - stop * mult; addOrder(high >= targetPrice or low <= stopPrice); SetColor(GetColor(7)) - Select OK.
- Select “New” in the lower left-hand corner.
- Name the short exit (i.e., ThreeBarInsideSX)
- Click in the script editor window, remove “declare LONG_ENTRY,” and paste in the following:
# Three-Bar Inside Bar SX declare SHORT_EXIT; input offsetType = {default percent, value, tick}; input target = 0.75; input stop = 0.75; def entryPrice = entryPrice(); def mult; switch (offsetType) { case percent: mult = entryPrice / 100; case value: mult = 1; case tick: mult = tickSize(); } def targetPrice = entryPrice - target * mult; def stopPrice = entryPrice + stop * mult; addOrder(high >= stopPrice or low <= targetPrice); SetColor(GetColor(7)); - Select OK.
- Select OK to apply the strategies to the chart.

METASTOCK: THREE-BAR INSIDE BAR PATTERN
Johnan Prathap’s article in this issue, “Three-Bar Inside Bar Pattern,” presents a pattern-based trading system. The MetaStock formulas and instructions for adding these formulas to MetaStock are as follows:.
To create a system test:
- Select Tools → the Enhanced System Tester.
- Click New
- Enter a name.
- Select the Buy Order tab and enter the following formula.
con1:= C > Ref(C, -1);
con2:= H < Ref(H, -1) AND L > Ref(L, -1);
el:=con1 AND Ref(con1, -2) AND Ref(con2, -1);
Ref(el,-1)
- Select the Sell Order tab and enter the following formula.
con1:= C > Ref(C, -1);
con2:= H < Ref(H, -1) AND L > Ref(L, -1);
el:=con1 AND Ref(con1, -2) AND Ref(con2, -1);
H>=ValueWhen(1,Ref(el,-1),O*1.0075) OR
L<=ValueWhen(1,Ref(el,-1),O*0.9925)
- Set the Order Type to Stop.
- Select the Limit or Stop Price and enter the following formula:
con1:= C > Ref(C, -1);
con2:= H < Ref(H, -1) AND L > Ref(L, -1);
el:=con1 AND Ref(con1, -2) AND Ref(con2, -1);
pt:=ValueWhen(1,Ref(el,-1),O*1.0075);
sl:=ValueWhen(1,Ref(el,-1),O*0.9925);
If(L<= sl, sl, pt)
- Select the Sell Short Order tab and enter the following formula.
con1:= C < Ref(C, -1);
con2:= H < Ref(H, -1) AND L > Ref(L, -1);
es:=con1 AND Ref(con1, -2) AND Ref(con2, -1);
Ref(es, -1)
- Select the Buy to Cover Order tab and enter the following formula.
con1:= C < Ref(C, -1);
con2:= H < Ref(H, -1) AND L > Ref(L, -1);
es:=con1 AND Ref(con1, -2) AND Ref(con2, -1);
H>=ValueWhen(1,Ref(es,-1),O*1.0075) OR
L<=ValueWhen(1,Ref(es,-1),O*0.9925)
- Set the Order Type to Stop.
- Select the Limit or Stop Price and enter the following formula:
con1:= C < Ref(C, -1);
con2:= H < Ref(H, -1) AND L > Ref(L, -1);
es:=con1 AND Ref(con1, -2) AND Ref(con2, -1);
pt:=ValueWhen(1,Ref(es,-1),O*0.9925);
sl:=ValueWhen(1,Ref(es,-1),O*1.0075);
If(H>= sl, sl, pt)
- Click OK to close the system editor.
When running the test, set the “Order execution” options to use the opening prices with zero trade delay.
The system test formulas trigger on the bar after the pattern so that the system tester will enter on the open of the next bar. You can also create an exploration or an expert advisor to signal on the last bar of the pattern with the following formulas:
Buy signal:

con1:= C > Ref(C, -1);
con2:= H < Ref(H, -1) AND L > Ref(L, -1);
con1 AND Ref(con1, -2) AND Ref(con2, -1)

Sell short signal:

con1:= C < Ref(C, -1);
con2:= H < Ref(H, -1) AND L > Ref(L, -1);
con1 AND Ref(con1, -2) AND Ref(con2, -1)
Past MetaStock Traders’ Tips can be found at https://www.equis.com/customer/resources/tasc/.

eSIGNAL: THREE-BAR INSIDE BAR PATTERN
For this month’s Traders’ Tip, we’ve provided the formula ThreeBar_Ibp.efs based on the formula code from Johnan Prathap’s article in this issue, “Three-Bar Inside Bar Pattern.”
The study contains two formula parameters to set the values for the profit target and stop-loss levels, which may be configured through the Edit Studies window in version 10.6 of eSignal (Advanced Chart menu → Edit Studies).
A sample chart is shown in Figure 4.
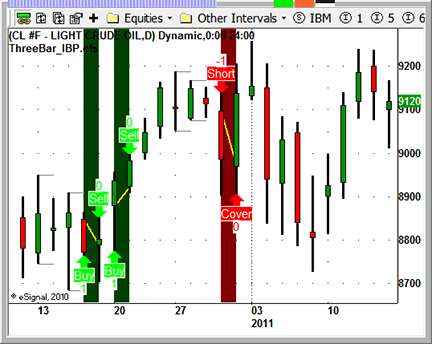
Figure 4: eSIGNAL, Three-Bar Inside Bar Pattern
To discuss this study or download a complete copy of the formula code, please visit the Efs Library Discussion Board forum under the Forums link from the Support menu at www.esignalcentral.com or visit our Efs KnowledgeBase at www.esignalcentral.com/support/kb/efs/.
/*********************************
Provided By:
    Interactive Data Corporation (Copyright © 2010)
    All rights reserved. This sample eSignal Formula Script (EFS)
    is for educational purposes only. Interactive Data Corporation
    reserves the right to modify and overwrite this EFS file with
    each new release.

Description:
    Three-Bar Inside Bar Pattern

Version:            1.0  14/01/2011

Formula Parameters:                     Default:
    Profit Target Level                   0.75
    Stop-loss Level                       0.75


Notes:
    The related article is copyrighted material. If you are not
    a subscriber of Stocks & Commodities, please visit www.traders.com.

**********************************/
var fpArray = new Array();
var bVersion = null;
function preMain()
{

    setPriceStudy(true);

    var x=0;
    fpArray[x] = new FunctionParameter("gPT", FunctionParameter.NUMBER);
    with(fpArray[x++])
    {
	setName("Profit Target Level");
	setLowerLimit(0.0001);
        setDefault(0.75);
    }
    fpArray[x] = new FunctionParameter("gSL", FunctionParameter.NUMBER);
    with(fpArray[x++])
    {
	setName("Stop-loss Level");
	setLowerLimit(0.0001);
        setDefault(0.75);
    }
}

var i = 0;
var entryPrice = 0;
var startPos = 0;
function main(gPT, gSL)
{
    if (bVersion == null) bVersion = verify();
    if (bVersion == false) return;

    if (getCurrentBarIndex() == 0 || getCurrentBarCount() < 4) return;

    if ((high(0) < high(-1)) && (low(0) > low(-1)))
    {
        drawLineRelative(-1,high(-1),0,high(-1), PS_SOLID, 1, Color.grey, i++);
        drawLineRelative(-1,low(-1),0,low(-1), PS_SOLID, 1, Color.grey, i++);
    }

    // Exit Strategy
    if (Strategy.isLong())
    {
            startPos --;
            if (high(0) >= entryPrice+entryPrice*(gPT / 100))
            {//limit long position
                Strategy.doSell("Exit Long", Strategy.LIMIT, Strategy.THISBAR,
 Strategy.ALL, Math.max(open(0), (entryPrice+entryPrice*(gPT / 100))));
                drawShapeRelative(0,AboveBar1, Shape.DOWNARROW, null, Color.lime,
 Shape.PRESET, i++);
                drawTextRelative(0,AboveBar2, "Sell", Color.white, Color.lime,
 Text.PRESET|Text.FRAME|Text.CENTER, "Arial", 10, i++);
                drawTextRelative(0,AboveBar3, "0", Color.lime, null, Text.PRESET
 | Text.CENTER, "Arial", 10, i++);
                drawLineRelative(startPos, open(startPos), 0, open(0), PS_SOLID,
 2, Color.yellow, i++);
            }
            if (low(0) <= entryPrice-entryPrice*(gSL / 100))
                if (getCurrentBarIndex() == -5) debugPrintln(entryPrice-entryPrice*(gSL / 100));
            {//stop long position
                Strategy.doSell("Exit Long", Strategy.STOP, Strategy.THISBAR, Strategy.ALL,
 Math.min(open(0), (entryPrice-entryPrice*(gSL / 100))));
                drawShapeRelative(0,AboveBar1, Shape.DOWNARROW, null, Color.lime,
 Shape.PRESET, i++);
                drawTextRelative(0,AboveBar2, "Sell", Color.white, Color.lime,
 Text.PRESET|Text.FRAME|Text.CENTER, "Arial", 10, i++);
                drawTextRelative(0,AboveBar3, "0", Color.lime, null, Text.PRESET
 | Text.CENTER, "Arial", 10, i++);
                drawLineRelative(startPos, open(startPos), 0, open(0), PS_SOLID,
 2, Color.yellow, i++);
            }
    }
    if (Strategy.isShort())
    {
            startPos--;
            if (low(0) <= entryPrice-entryPrice*(gPT / 100))
            {//limit short position
                Strategy.doCover("Exit Short", Strategy.LIMIT, Strategy.THISBAR,
 Strategy.ALL, Math.min(open(0), (entryPrice-entryPrice*(gSL / 100))));
                drawShapeRelative(0,BelowBar1, Shape.UPARROW, null, Color.red,
 Shape.PRESET, i++);
                drawTextRelative(0,BelowBar2, "Cover", Color.white, Color.red,
 Text.PRESET|Text.FRAME|Text.CENTER, "Arial", 10, i++);
                drawTextRelative(0,BelowBar3, "0", Color.red, null, Text.PRESET|Text.CENTER,
 "Arial", 10, i++);
                drawLineRelative(startPos, open(startPos), 0, open(0), PS_SOLID,
 2, Color.yellow, i++);
            }
            if (high(0) >= entryPrice+entryPrice*(gSL / 100))
            {//stop short position
                Strategy.doCover("Exit Short", Strategy.STOP, Strategy.THISBAR,
 Strategy.ALL, Math.max(open(0), (entryPrice+entryPrice*(gSL / 100))));
                drawShapeRelative(0,BelowBar1, Shape.UPARROW, null, Color.red,
 Shape.PRESET, i++);
                drawTextRelative(0,BelowBar2, "Cover", Color.white, Color.red,
 Text.PRESET|Text.FRAME|Text.CENTER, "Arial", 10, i++);
                drawTextRelative(0,BelowBar3, "0", Color.red, null, Text.PRESET|Text.CENTER,
 "Arial", 10, i++);
                drawLineRelative(startPos, open(startPos), 0, open(0), PS_SOLID,
 2, Color.yellow, i++);
            }
    }

    // Entry Strategy
    if (!Strategy.isInTrade())
    {
            if ((close(-1) > close(-2)) && (high(-2) < high(-3)) && (low(-2) >
 low(-3)) && (close(-3) > close(-4)))
            {//entry long position
                Strategy.doLong ("Entry Long", Strategy.MARKET, Strategy.THISBAR);
                drawShapeRelative(0,BelowBar1, Shape.UPARROW, null, Color.lime,
 Shape.PRESET, i++);
                drawTextRelative(0,BelowBar2, "Buy", Color.white, Color.lime,
 Text.PRESET|Text.FRAME|Text.CENTER, "Arial", 10, i++);
                drawTextRelative(0,BelowBar3, "1", Color.lime, null, Text.PRESET|Text.CENTER,
 "Arial", 10, i++);
                entryPrice = close(-1);
                startPos = 0;
            }
            if ((close(-1) < close(-2)) && (high(-2) < high(-3)) && (low(-2) >
 low(-3)) && close(-3) < close(-4))
            {//entry short position
                Strategy.doShort ("Entry Short", Strategy.MARKET, Strategy.THISBAR);
                drawShapeRelative(0,AboveBar1, Shape.DOWNARROW, null, Color.red,
 Shape.PRESET, i++);
                drawTextRelative(0,AboveBar2, "Short", Color.white, Color.red,
 Text.PRESET|Text.FRAME|Text.CENTER, "Arial", 10, i++);
                drawTextRelative(0,AboveBar3, "-1", Color.red, null, Text.PRESET
  | Text.CENTER, "Arial", 10, i++);
                entryPrice = close(-1);
                startPos = 0;
            }
    }

    if (Strategy.isLong()) setBarBgColor(Color.darkgreen);
    if (Strategy.isShort()) setBarBgColor(Color.maroon);

}

function verify() {
    var b = false;
    if (getBuildNumber() < 779) {
        drawTextAbsolute(5, 35, "This study requires version 8.0 or later.",
            Color.white, Color.blue, Text.RELATIVETOBOTTOM|Text.RELATIVETOLEFT|Text.BOLD|Text.LEFT,
            null, 13, "error");
        drawTextAbsolute(5, 20, "Click HERE to upgrade.@URL=https://www.esignal.com/download/default.asp",
            Color.white, Color.blue, Text.RELATIVETOBOTTOM|Text.RELATIVETOLEFT|Text.BOLD|Text.LEFT,
            null, 13, "upgrade");
        return b;
    } else {
        b = true;
    }
    return b;
}

WEALTH-LAB: THREE-BAR INSIDE BAR PATTERN
This Traders’ Tip is based on “Three-Bar Inside Bar Pattern” by Johnan Prathap in this issue.
Our WealthScript solution automatically identifies the pattern on the chart with a routine called HighlightPattern that you might find useful in other pattern-recognition scripts. As Figure 5 shows, the three-bar pattern occurs more frequently than you otherwise might expect in the CL, SI, and GC (which is the symbol plotted in Figure 5) electronic sessions.
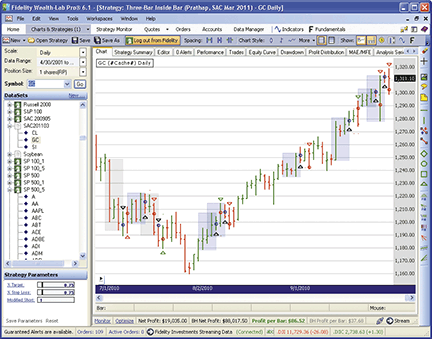
Figure 5: WEALTH-LAB, Three-Bar Inside Bar Pattern. The light gray and blue boxes highlight the short and long setups, respectively.
While testing the code, we noticed that short trade triggers (that is, the last bar in the pattern) for which the close was below the low of the previous bar had a better success rate than if the close were simply lower than the previous close. Just toggle the “Modified short” parameter to test both versions of the strategy. Although the modification made practically no difference for SI, it increased the overall net profit for both GC and CL significantly over the test period.
C# code for Wealth-Lab:

using System;
using System.Collections.Generic;
using System.Drawing;
using WealthLab;

namespace WealthLab.Strategies
{
   public class ThreeBarPatternFutures : WealthScript
   {
      StrategyParameter _target;
      StrategyParameter _stoploss;
      StrategyParameter _modifiedShortTrigger;

      public ThreeBarPatternFutures()
      {
         _target = CreateParameter("% Target", 0.75, 0.5, 2.5, 0.05);
         _stoploss = CreateParameter("% Stop Loss", 0.75, 0.5, 2.5, 0.05);
         _modifiedShortTrigger = CreateParameter("Modified Short", 1, 0, 1, 1);
      }

      private void HighlightPattern(int bar, Color color, int patternBars)
      {
         double hi = High[bar];
         double lo = Low[bar];

         if (patternBars > 1)
         {
            int p = patternBars - 1;
            for (int n = bar - 1; n >= bar - p; n--)
            {
               hi = High[n] > hi ? High[n] : hi;
               lo = Low[n] < lo ? Low[n] : lo;
            }
         }
         int b1 = bar - patternBars;
         int b2 = Math.Min(bar + 1, Bars.Count - 1);
         DrawPolygon(PricePane, color, color, LineStyle.Invisible, 1, true, b1,
 hi, b2, hi, b2, lo, b1, lo);
      }

      protected override void Execute()
      {
         Position p = null;
         double target = 1e6;
         double stop = 0d;
         PlotStops();
         HideVolume();

         for(int bar = 3; bar < Bars.Count; bar++)
         {
            if (IsLastPositionActive)
            {
               p = LastPosition;
               if (!ExitAtStop(bar + 1, p, stop, "Stop Loss"))
                  ExitAtLimit(bar + 1, p, target, "Profit Target");
            }
            else
            {
               bool setup1L = Close[bar - 3] < Close[bar - 2];
               bool setup1S = Close[bar - 3] > Close[bar - 2];
               bool setup2 = High[bar - 2] > High[bar - 1] && Low[bar - 2] < Low[bar - 1];
               bool setup3L = Close[bar - 1] < Close[bar];

               bool setup3S = Close[bar - 1] > Close[bar];
               if (_modifiedShortTrigger.ValueInt == 1)
                  setup3S = Low[bar - 1] > Close[bar];

               if (setup1L && setup2 && setup3L)
               {
                  HighlightPattern(bar, Color.FromArgb(30, Color.Blue), 3);
                  if (BuyAtMarket(bar + 1) != null)
                  {
                     p = LastPosition;
                     target = p.EntryPrice * (1 + _target.Value/100d);
                     stop = p.EntryPrice * (1 - _stoploss.Value/100d);
                  }
               }
               else if (setup1S && setup2 && setup3S)
               {
                  HighlightPattern(bar, Color.FromArgb(20, Color.Black), 3);
                  if (ShortAtMarket(bar + 1)  != null)
                  {
                     p = LastPosition;
                     target = p.EntryPrice * (1 - _target.Value/100d);
                     stop = p.EntryPrice * (1 + _stoploss.Value/100d);
                  }
               }
            }
         }
      }
   }
}

AMIBROKER: THREE-BAR INSIDE BAR PATTERN
In “Three-Bar Inside Bar Pattern” in this issue, author Johnan Prathap presents a simple trading system based on short-term candlestick patterns. Coding this system in AmiBroker Formula Language is straightforward. A ready-to-use formula for the article is shown below. To use the formula, enter it in the Afl Editor, then press the “Send to automatic analysis” button. In Automatic Analysis, press the “Backtest” button to perform a historical system test. Note that the formula has parameters set for the CL (crude oil) contract. You may need to modify them for testing different instruments.
LISTING 1.
Cond1 = Close > Ref( Close, -1 );
Cond2 = High < Ref( High, -1 ) AND Low > Ref( Low, -1 );
Cond3 = Close < Ref( Close, -1 );

SetTradeDelays( 1, 1, 1, 1 );

Buy = Cond1 AND Ref( Cond2, -1 ) AND Ref( Cond1, -2 );
BuyPrice = Open;
Short = Cond3 AND Ref( Cond2, -1 ) AND Ref( Cond3, -2 );
ShortPrice = Open;

Sell = Cover = False; // exits only by stops

// profit target being higher than loss gives better result
// than proposed in article equal to 0.75%
Target = 6.5;
Loss = 0.75; // 0.75% max loss stop;

SetOption("InitialEquity", 30000 );

ApplyStop( stopTypeLoss, stopModePercent, Loss, True );
ApplyStop( stopTypeProfit, stopModePercent, Target, True );

SetOption("ActivateStopsImmediately", False ); // activate stops next bar
SetPositionSize( 1, spsShares );
PointValue = 1000; // big point value NYMEX CL
MarginDeposit = 5063; // overnight margin NYMEX CL

WORDEN BROTHERS TC2000: THREE-BAR INSIDE BAR PATTERN
The three-bar pattern setups in Johnan Prathap’s article in this issue (“Three-Bar Inside Bar Pattern”) are simple to implement in TC2000 version 11 using the Personal Criteria Formula (Pcf) language. The code follows for the positive and negative inside bar setups.
Three-Bar Positive Inside Bar
C > C1 AND L2 < L1 AND H1 < H2 AND C2 > C3

Three-Bar Negative Inside Bar
C < C1 AND L2 < L1 AND H1 < H2 AND C2 < C3
Setting up the Pcfs is easy and you can use them in an EasyScan or to sort any list in the system.
In Figure 6, we’ve used the three-bar positive inside bar Pcf to scan the US common stocks watchlist, and it returned 143 stocks. The list is sorted by “Earnings 1-year,” putting some familiar stocks at the top of the list.
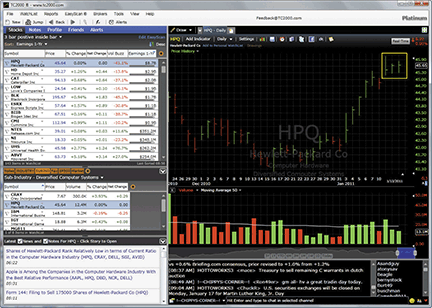
Figure 6: TC2000, Three-Bar Inside Bar Pattern. Here are sample scan results for the three-bar positive inside bar setup. This scan was done using daily data. Platinum subscribers can run the same scan on any time frame (daily, hourly, five-minute bars, and so forth).
For more information or to start a free trial of TC2000, please visit www.TC2000.com.

NEUROSHELL TRADER: THREE-BAR INSIDE BAR PATTERN
The three-bar inside bar pattern trading system as described by Johnan Prathap in his article in this issue can be easily implemented with a few of NeuroShell Trader’s 800+ indicators. Simply select “New Trading Strategy…” from the Insert menu and enter the formulas in the appropriate locations of the Trading Strategy Wizard:
Generate a buy long order if all of the following are true:
      A>B(Lag(Close,2),Lag(Close,3))
      A<B(Lag(High,1),Lag(High,2))
      A>B(Lag(Low,1),Lag(Low,2))
      A>B(Close,Lag(Close,1))

Generate a long protective stop order at the following price level:
      PriceFloor%(Trading Strategy,0.75)

Generate a long exit order if all of the following are true:
     PriceTarget%(Trading Strategy,0.75)

Generate a sell short order if all of the following are true:
	A<B(Lag(Close,2),Lag(Close,3))
    A<B(Lag(High,1),Lag(High,2))
    A>B(Lag(Low,1),Lag(Low,2))
    A<B(Close,Lag(Close,1))

Generate a short protective stop order at the following price level:
	PriceFloor%(Trading Strategy,0.75)

Generate a cover short order if all of the following are true:
     PriceTarget%(Trading Strategy,0.75)
If you have NeuroShell Trader Professional, you can also choose whether the parameters should be optimized. After backtesting the trading strategy, use the “Detailed Analysis…” button to view the backtest and trade-by-trade statistics for the strategy.
Users of NeuroShell Trader can go to the Stocks & Commodities section of the NeuroShell Trader free technical support website to download a copy of this or any previous Traders’ Tips.
A sample chart is shown in Figure 7.
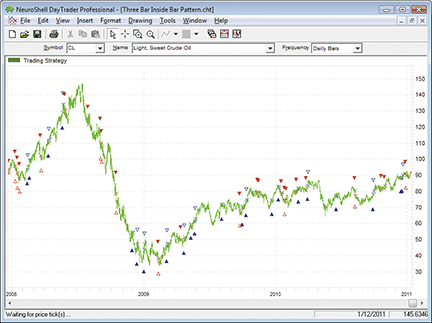
Figure 7: NEUROSHELL TRADER, Three-Bar Inside Bar Pattern. This NeuroShell Trader chart shows the three-bar inside bar pattern trading system for daily crude oil.

AIQ: THREE-BAR INSIDE BAR PATTERN
The Aiq code for this Traders’ Tip is for the three-bar inside bar pattern as described by Johnan Prathap in his article in this issue, “Three-Bar Inside Bar Pattern.”
I tested the system on three Etfs: Spy (S&P 500), Iwm (Russell 2000 index), and Qqqq (Nasdaq 100) over the period 1/1/2001 to 1/11/2011. I did not allow exits on the same bar as entries, as it is impossible to tell whether the stop-loss or the profit target would have been hit on the day of entry. Hence, all exits were applied on the second bar of the trade. The long trades for the portfolio lost an average of 0.17% per trade on 119 trades. The short trades lost an average of 0.24% per trade on 170 trades. The average holding period was 1.6 bars. Commission and slippage were not considered in these results.
The code and Eds file can be downloaded from www.TradersEdgeSystems.com/traderstips.htm.
!! THREE-BAR INSIDE BAR PATTERN
! Author: Johnan Prathap TASC March 2011
! Coded by: Richard Denning 01/11/2011
! www.TradersEdgeSystems.com

!! INPUTS:
SLpct 	is 0.75.
PTpct	is 0.75.

!!ABBREVIATIONS:
O	is [open].
O1	is valresult(O,1).
L 	is [low].
L1	is valresult(L,1).
H 	is [high].
H1	is valresult(H,1).
C 	is [close].
C1 	is valresult(C,1).
OSD 	is offSetToDate(month(),day(),year()).
RunDate is ReportDate().
PD	is {position days}.
PEP	is {position entry price}.

!! BAR PATTERN RULES:
UpC	if C > C1.
DnC	if C < C1.
InBar	if H < H1 and L > L1.

!! ENTRY & EXIT RULES:

! LONG ENTRY:
LE 	if UpC and valrule(InBar,1) and valrule(UpC,2).

! SHORT ENTRY:
SE	if DnC and valrule(InBar,1) and valrule(DnC,2).

! EXIT LONGS:
PT	is PEP * (1+PTpct/100).
SL	is PEP * (1-SLpct/100).
LX_PT	if H >= PT.
LX_SL	if L <= SL.
LX	if LX_PT or LX_SL.

! EXIT SHORTS:
PTs	is PEP * (1-PTpct/100).
SLs	is PEP * (1+SLpct/100).
SX_PTs	if L <= PTs.
SX_SLs 	if H >= SLs.
SX	if SX_PTs or SX_SLs.

! EXIT PRICING LONGS:
LX_Price is iff(LX_SL,min(SL,O),iff(LX_PT,max(PT,O),-99)).

! EXIT PRICING SHORTS:
SX_Price is iff(SX_SLs,max(SLs,O),iff(SX_PTs,min(PTs,O),-99)).

TRADERSSTUDIO: THREE-BAR INSIDE BAR PATTERN
In testing the trading system suggested by Johnan Prathap in his article in this issue, I used Pinnacle Data for the same three futures contracts, ZG (electronic gold), ZU (electronic crude oil), and ZI (electronic silver). I used the electronically traded data since the pit trading for these contracts has nearly disappeared and the volumes are too light. Unfortunately, I was not able to obtain results that were close to the author’s, as the consolidated portfolio lost $1,650 with a maximum drawdown of $29,810 trading one each of the three contracts. In addition, no provision was made for commission and slippage. The difference in performance is probably due to the difference in the data between the TradeStation data (which the author used) and the data I used from Pinnacle Data.
In Figures 8 and 9, I show the resulting consolidated equity curve and consolidated underwater equity curve, respectively, for the portfolio of futures contracts using Pinnacle Data for the electronically traded contracts.
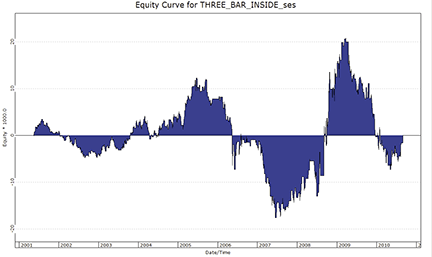
Figure 8: TRADERSSTUDIO, Three-Bar Inside Bar Pattern, equity curvE. Here is the equity curve for the period 5/1/2001 to 8/31/2010 trading one contract each of ZG, ZU, and ZI (based on data from Pinnacle Data).
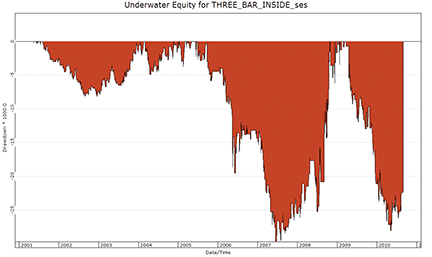
Figure 9: TRADERSSTUDIO, Three-Bar Inside Bar Pattern, UNDERWATER equity curve. Here is the underwater equity curve for the period 5/1/2001 to 8/31/2010 trading one contract each of ZG, ZU, and ZI (based on data from Pinnacle Data).
The code can be downloaded from the TradersStudio website at www.TradersStudio.com→Traders Resources→FreeCode or www.TradersEdgeSystems.com/traderstips.htm.
' THREE-BAR INSIDE BAR PATTERN
' Author: Johnan Prathap TASC March 2011
' Coded by: Richard Denning 01/11/2011
' www.TradersEdgeSystems.com
Sub THREE_BAR_INSIDE(SLpct,PTpct)
Dim upC As BarArray
Dim dnC As BarArray
Dim inBar As BarArray
Dim MP As BarArray
Dim PT, PTs, SL, SLs
upC = C > C[1]
dnC = C < C[1]
inBar = H < H[1] And L > L[1]
MP = marketpos(0)
PT = EntryPrice * (1+PTpct/100)
SL = EntryPrice * (1-SLpct/100)
PTs = EntryPrice * (1-PTpct/100)
SLs = EntryPrice * (1+SLpct/100)
If MP = 0 Then
If upC And inBar[1] And upC[2] Then
Buy("LE",1,0,Market,Day)
End If
If dnC And inBar[1] And dnC[2] Then
Sell("SE",1,0,Market,Day)
End If
End If
If MP = 1 Then
ExitLong("LX_PT","",1,PT,Limit,Day)
ExitLong("LX_SL","",1,SL,Stop,Day)
End If
If MP = -1 Then
ExitShort("SX_PT","",1,PTs,Limit,Day)
ExitShort("SX_SL","",1,SLs,Stop,Day)
End If
End Sub

TRADECISION: THREE-BAR INSIDE BAR PATTERN
The article by Johnan Prathap in this issue, “Three-Bar Inside Bar Pattern,” describes a trading strategy that uses an inside bar as a three-bar pattern for long and short positions.
You can use Tradecision’s Strategy Builder to recreate the three-bar inside bar pattern strategy with the code below.
To import the strategy into Tradecision, visit the area “Traders’ Tips from Tasc Magazine” at www.tradecision.com/support/tasc_tips/tasc_traders_tips.htm or copy the code below.
Entry Long Rule:

var
Cond1:=false;
Cond2:=false;
end_var

if Close > Close\1\ then
   Cond1 := true;
if High < High\1\ AND Low > Low\1\ then
   Cond2 := true;


If IsInPosition() = false then
   begin
        If Cond1 and cond2\1\ and Cond1\2\ then
           return true;
   end;
return false;

Entry Short Rule:

var
Cond2:=false;
Cond3:=false;
end_var

if High < High\1\ AND Low > Low\1\ then
   Cond2 := true;
if Close < Close\1\ then
   Cond3 := true;


If IsInPosition() = false then
   begin
        If Cond3 and cond2\1\ and Cond3\2\ then
           return true;
   end;
return false;

Exit Long Rule:

If IsLongPosition() = true then
   return true;

return false;

Exit Long Limit Price:

var
Tr:=0.75;
end_var

return SignalEntryPrice + (SignalEntryPrice * Tr/100);


Exit Long Stop Price:

var
Sl:=0.75;
end_var

return SignalEntryPrice - (SignalEntryPrice * Sl/100);

Exit Short Rule:

If IsShortPosition() = true then
   return true;

return false;

Exit Short Limit Price:

var
Tr:=0.75;
end_var

return SignalEntryPrice - (SignalEntryPrice * Tr/100);

Exit Short Stop Price:

var
Sl:=0.75;
end_var

return SignalEntryPrice + (SignalEntryPrice * Sl/100);
A sample chart is shown in Figure 10.
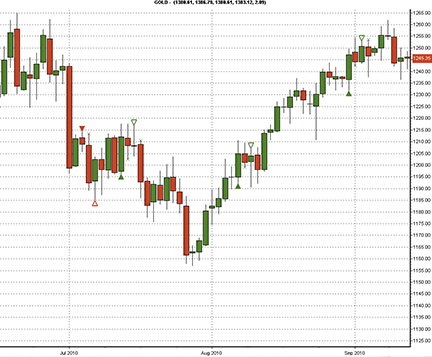
FIGURE 10: TRADECISION, GOLD DAILY CHART WITH THE THREE-BAR INSIDE BAR PATTERN STRATEGY APPLIED. This shows four profitable trading signals generated by the three-bar inside bar pattern strategy for gold from July to September 2010.

WAVE59: THREE-BAR INSIDE BAR PATTERN
In his article in this issue, Johnan Prathap describes a three-bar inside bar pattern used to time entries and exits.
You can see a nice set of short signals in the bond chart in Figure 11 using his approach. As an aside to readers interested in conducting their own experimentation with this method, we found superior results were attained by reversing the requirement for the third bar in the particular pattern, requiring a downward close for buy signals, and an upward close for sells. This tweak can be accomplished by editing lines 11 and 27 in the Wave59 code, and should provide fertile ground for further research.
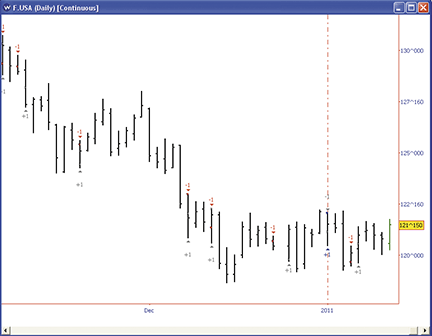
FIGURE 11: WAVE59, Three-Bar Inside Bar Pattern. You can see a nice set of short signals in this bond chart based on Prathap’s approach.
As always, users of Wave59 can download scripts directly using the QScript Library found at https://www.wave59.com/library.
Indicator:  SC_Prathap_InsideBar
input:tr(0.75),sl(0.75);

#test for pattern conditions
one = close > close[1];
two = (high < high[1]) and (low > low[1]);

#buy setup
if ((one==true) and (two[1]==true) and (one[2]==true))
{
    if (marketposition<=0) {
        cancelall();
        buy(1,nextopen,"nextopen","onebar");

        #set stop/limit up as order-cancels-order
        ref1 = exitlong(0,nextopen-(nextopen*(sl/100.0)),"stop","gtc");
        ref2 = exitlong(0,nextopen+(nextopen*(tr/100.0)),"limit","gtc");
        oco = to_string(barnum);
        setocotag(ref1,oco);
        setocotag(ref2,oco);
    }
}

#sell setup
if ((one==false) and (two[1]==true) and (one[2]==false))
{
    if (marketposition>=0) {
        cancelall();
        sell(1,nextopen,"nextopen","onebar");

        #set stop/limit up as order-cancels-order
        ref1 = exitshort(0,nextopen+(nextopen*(sl/100.0)),"stop","gtc");
        ref2 = exitshort(0,nextopen-(nextopen*(tr/100.0)),"limit","gtc");
        oco = to_string(barnum);
        setocotag(ref1,oco);
        setocotag(ref2,oco);
    }
}
--------------------------------------------

NINJATRADER: THREE-BAR INSIDE BAR PATTERN
The three-bar inside bar pattern automated strategy as discussed in “Three-Bar Inside Bar Pattern” by Johnan Prathap in this issue has been implemented as a strategy available for download at www.ninjatrader.com/SC/March2011SC.zip.
Once it has been downloaded, from within the NinjaTrader Control Center window, select the menu File → Utilities → Import NinjaScript and select the downloaded file. This strategy is for NinjaTrader version 7 or greater.
You can review the strategy source code by selecting the menu Tools → Edit NinjaScript → Strategy from within the NinjaTrader Control Center window and selecting “ThreeBarInsideBar.”
NinjaScript uses compiled Dlls that run native, not interpreted, which provides you with the highest performance possible.
A sample chart implementing the strategy is shown in Figure 12.
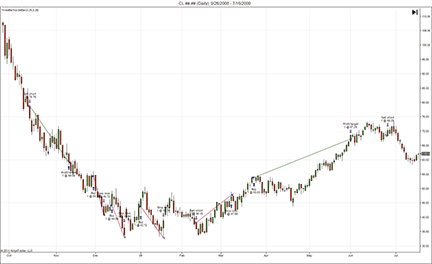
Figure 12: NINJATRADER, Three-Bar Inside Bar Pattern. This screenshot shows the ThreeBarInsideBar strategy applied to a daily continuous chart of crude light (CL).

NEOTICKER: THREE-BAR INSIDE BAR PATTERN
The trading setups presented in the article “Three-Bar Inside Bar Pattern” by Johnan Prathap in this issue can be implemented in NeoTicker using our power indicator, Backtest EZ (Figure 13).
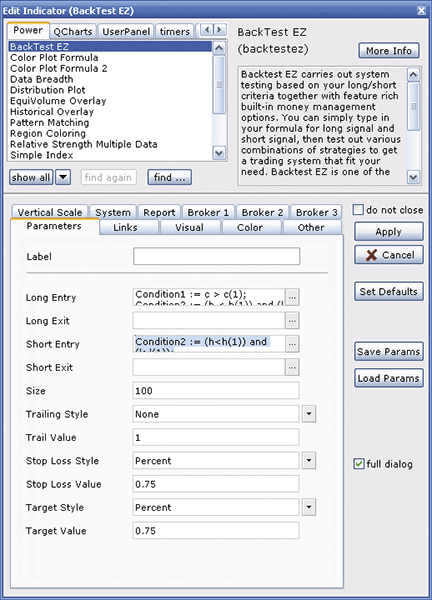
Figure 13: NEOTICKER, Three-Bar Inside Bar PatterN. Here is how to set up the system using NeoTicker’s Backtest EZ.
Enter the long signal formula (Listing 1) into the long entry field and enter the short signal formula (Listing 2) into the short entry field. Then change the stop-loss style to “percent”; enter the stop low value of 0.75; change the target style to “percent”; enter the target value as 0.75. Next, to get a proper system-testing result, in the “system” tab for the indicator setup, change the price multiple and minimum tick size to match the instrument that is currently being tested.
Listing 1
Condition1 := c > c(1);
Condition2 := (h < h(1)) and (l > low(1));
(Condition1>0) and (Condition2(1)>0) and (Condition1(2)>0)

Listing 2
Condition2 := (h<h(1)) and (l>l(1));
Condition3 := c<c(1);
(Condition3>0) and(Condition2(1)>0) and(Condition3(2)>0)
A downloadable NeoTicker export group will be available for download at the NeoTicker blog site (https://blog.neoticker.com).

TRADE NAVIGATOR: THREE-BAR INSIDE BAR PATTERN
Here, we will show you how to recreate the strategy described by author Johnan Prathap in his article in this issue, “Three-Bar Inside Bar Pattern.” The strategy for this article is easy to recreate and test in Trade Navigator.
- Go to the Strategies tab in the Trader’s Toolbox.
- Click on the New button. Click the New Rule button.
- To create the long entry rule type the following code:
&cond1 := Close > Close.1
&cond2 := High < High.1 And Low > Low.1

IF &cond1 And &cond2 And (&cond1).2
- Set the Action to Long Entry (Buy) and the Order Type to Market.
- Click on the Save button. Type a name for the rule and then click the OK button.
- Repeat these steps for the long exit rule using the following code:
Long Profit rule:
IF Position = 1
- Set the Action to Long Exit (Sell) and the Order Type to Limit.
- In the Limit Price box type:
Entry Price + (Entry Price * T / 100)
- Click on the Verify button. When prompted click the Add button. Set the Default Value for T to 0.75.
- Click the Save button, type a name for the long profit exit and click the OK button.
Long Stop rule:
IF Position = 1
- Set the Action to Long Exit (Sell) and the Order Type to Limit.
- In the Limit Price box type:
Entry Price - (Entry Price * SI / 100)
- Click on the Verify button. When prompted click the Add button. Set the Default Value for SI to 0.75.
- Click the Save button, type a name for the long stop exit and click the OK button.
Short Entry rule:
&cond3 := Close < Close.1
&cond2 := High < High.1 And Low > Low.1

IF &cond3 And &cond2 And (&cond3).2
- Set the Action to Short Entry (Sell) and the Order Type to Market.
- Click the Save button, type a name for the short entry and click the OK button.
Short Profit rule:
IF Position = -1
- Set the Action to Short Exit (Buy) and the Order Type to Limit.
- In the Limit Price box type:
Entry Price - (Entry Price * T / 100)
- Click on the Verify button. When prompted click the Add button. Set the Default Value for T to 0.75.
- Click the Save button, type a name for the short profit exit and click the OK button.
Short Stop rule:
IF Position = -1
- Set the Action to Short Exit (Buy) and the Order Type to Stop.
- In the Limit Price box type:
Entry Price + (Entry Price * SI / 100)
- Click on the Verify button. When prompted click the Add button. Set the Default Value for SI to 0.75.
- Click the Save button, type a name for the short stop exit, and click the OK button.
- Save the strategy by clicking the Save button, typing Three-Bar Inside Bar Pattern for the name of the strategy and then clicking the OK button.
You can test your new strategy by clicking the Run button to see a report, or you can apply the strategy to a chart for a visual representation of where the strategy would place trades over the history of the chart.
This strategy will be available as a downloadable file for Trade Navigator. Click on the blue phone icon in Trade Navigator, select “Download special file,” type “SC1103,” and click on the Start button.

UPDATA: THREE-BAR INSIDE PATTERN
This is based on Johnan Prathap’s article in this issue, “Three-Bar Inside Pattern”.
In the article, Prathap sets up a market timing system based on price patterns to determine points of trend exhaustion in gold, silver, and crude oil contracts, with entries into an anticipated reversal and fixed-percentage stop and profit levels.
The Updata code for this system has been added to the Updata System Library and may be downloaded by clicking the Custom menu and then System Library. Those who cannot access the library due to a firewall may paste the code shown below into the Updata Custom editor and save it.
NAME "Three Bar Inside Bar Pattern"
DISPLAYSTYLE CUSTOM
INDICATORTYPE TOOL
PARAMETER "Profit Target %" @Prof=0.75
PARAMETER "Stop Level %" @Stop=0.75

@CONDITION=0
@CONDITION1=0
@CONDITION2=0
@CONDITION3=0
@LONGSTOP=0
@LONGPROFIT=0
@SHORTSTOP=0
@SHORTPROFIT=0

FOR #CURDATE=0 TO #LASTDATE

   @CONDITION1=CLOSE>CLOSE(1)
   @CONDITION2=HIGH<HIGH(1) AND LOW>LOW(1)
   @CONDITION3=CLOSE<CLOSE(1)

   'EXIT CONDITIONS
   If ORDERISOPEN>0
      if HIGH>@LONGPROFIT
         SELL @LONGPROFIT
      elseif LOW<@LONGSTOP
         SELL @LONGSTOP
      endif
   ElseIf ORDERISOPEN<0
      if LOW<@SHORTPROFIT
         COVER @SHORTPROFIT
      elseif HIGH>@SHORTSTOP
         COVER @SHORTSTOP
       endif
   EndIf

   'ENTRY CONDITIONS
   If @CONDITION1 AND HIST(@CONDITION2,1) AND HIST(@CONDITION1,2)
      BUY OPEN(-1)
      @LONGSTOP=OPEN(-1)-(OPEN(-1)*@Stop/100)
      @LONGPROFIT=OPEN(-1)+(OPEN(-1)*@Prof/100)
   ElseIf @CONDITION3 AND HIST(@CONDITION2,1) AND HIST(@CONDITION3,2)
      SHORT OPEN(-1)
      @SHORTSTOP=OPEN(-1)+(OPEN(-1)*@Stop/100)
      @SHORTPROFIT=OPEN(-1)-(OPEN(-1)*@Prof/100)
   EndIf

NEXT
A sample chart is shown in Figure 14.
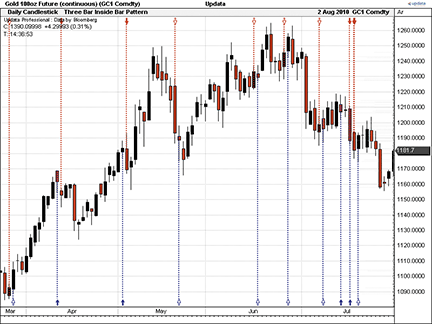
FIGURE 14: UPDATA, Three-Bar Inside Bar Pattern. The chart shows the three-bar inside bar pattern overlaid on the gold futures contract, with the profitable trade on May 18 denoted by a hollow red arrow.

TRADESIGNAL: THREE-BAR INSIDE BAR PATTERN
The three-bar inside bar pattern strategy by Johnan Prathap can be easily implemented using the free interactive online charting tool found at www.TradesignalOnline.com. In the tool, select “New strategy,” enter the code (shown below) in the online code editor, and save it. The strategy can then be added to any chart with a simple drag & drop (see Figure 15).
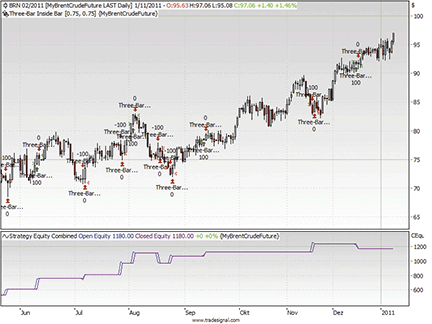
FIGURE 15: TRADESIGNAL ONLINE, Three-Bar Inside Bar Pattern. Here is an example of Johnan Prathap’s three-bar inside bar pattern strategy on a daily chart of Brent crude.
Meta:
       Subchart( False ),
       Synopsis("The Three-Bar Inside Bar Setup from March 2011 TAS&C"),
       WebLink("https://www.tradesignalonline.com/lexicon/edit.aspx?id=16309");

Input:
       Tr(0.75),
       Sl(0.75);

Condition1 = Close > Close[1];
Condition2 = High < High[1] AND Low > Low[1] ;
Condition3 = Close < Close[1];

If marketposition = 0 then
       begin
             If Condition1 and condition2[1] and Condition1[2] then
                    Buy next bar at Market;

             If Condition3 and condition2[1] and Condition3[2] then
                    Sell Short next bar at Market;
       end;

If marketposition = 1 then
       begin
             Sell next bar at entryprice+(entryprice*Tr/100) Limit;
             Sell next bar at entryprice-(entryprice*Sl/100) stop;
       end;

If marketposition = -1 then
       begin
             Buy to Cover next bar at entryprice-(entryprice*Tr/100) Limit;
             Buy to Cover next bar at entryprice+(entryprice*Sl/100) stop;
       End;

// *** Copyright tradesignal GmbH ***
// *** www.tradesignal.com ***
The strategy is also available in the Lexicon section of www.TradesignalOnline.com, where it can be imported with a single click.

TRADINGSOLUTIONS: THREE-BAR INSIDE BAR PATTERN
In the article “Three-Bar Inside Bar Pattern” in this issue, Johnan Prathap presents an entry-exit system for testing a three-bar inside pattern.
The entry portion of this system is available as a function file that can be downloaded from the TradingSolutions website (www.tradingsolutions.com) in the “Free Systems” section. Stop-losses and profit targets can be simulated using trading styles.
System Name: Three-Bar Inside Bar Entry
Inputs: Close, High, Low

Enter Long when all of these rules are true:
1. GT (Close, Lag (Close, 1))
2. LT (Lag (High, 1), Lag (High, 2))
3. GT (Lag (Low, 1), Lag (Low, 2))
4. GT (Lag (Close, 2), Lag (Close, 3))

Enter Short when all of these rules are true:
1. LT (Close, Lag (Close, 1))
2. LT (Lag (High, 1), Lag (High, 2))
3. GT (Lag (Low, 1), Lag (Low, 2))
4. LT (Lag (Close, 2), Lag (Close, 3))

SHARESCOPE: THREE-BAR INSIDE BAR PATTERN
For Johnan Prathap’s three-bar inside bar pattern system, which is described in his article elsewhere in this issue, we’ve written a script that colors the three-bar pattern either red for short trades or green for long trades. In addition, we display a P (profit) or L (loss) above the third bar of each pattern to indicate how the trade played out. This helps you judge the suitability of the technique when applying it to other instruments. Even over several years’ time frame, the P and L markers will show you at a glance a rough ratio of winning to losing trades. (See the chart of natural gas in Figure 16.)
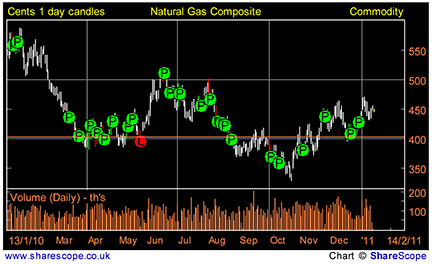
FIGURE 16: SHARESCOPE, Three-Bar Inside Bar Pattern. Here, Johnan Prathap’s system is applied to natural gas. The three-bar pattern is colored red for short trades or green for long trades. A “P” (profit) or “L” (loss) above the third bar of each pattern indicates how the trade played out, which tells you at a glance a rough ratio of winning to losing trades.
You can download this study from www.sharescript.co.uk.
//@Name:3 Bar Inside Pattern
//@Description:Displays buy and sell signals based on the Three-Bar Inside Bar Pattern.
 As described on Stocks & Commodities, March 2011.

// Care has been taken in preparing this code but it is provided without guarantee.
// You are welcome to modify and extend it.  Please add your name as a modifier if
 you distribute it.

var defaultCol = Colour.White;
var buyCol = Colour.Green;
var sellCol = Colour.Red;
var SL = 0.75;
var PT = 0.75;

function onNewChart()
{
	bars[0].colour = defaultCol;
	bars[1].colour = defaultCol;
	bars[2].colour = defaultCol;
	var buyBar = 0;
	var sellBar = 0;
	setFontColour(Colour.Black);
	for (var i=3;i<bars.length;i++)
	{
		bars[i].colour = defaultCol;
		if (buyBar && (bars[i].high>openPrice*(1+PT/100)))
		{
			setBrushColour(Colour.Green);
			drawSymbol(buyBar, bars[buyBar].high*1.005, Symbol.Circle, "P",
 BoxAlign.Centre|BoxAlign.Below);
			buyBar = 0;
		}
		else if (buyBar && bars[i].low<openPrice*(1-SL/100))
		{
			setBrushColour(Colour.Red);
			drawSymbol(buyBar, bars[buyBar].high*1.005, Symbol.Circle, "L",
 BoxAlign.Centre|BoxAlign.Below);
			buyBar = 0;
		}
		else if (sellBar && (bars[i].low<openPrice*(1-PT/100)))
		{
			setBrushColour(Colour.Green);
			drawSymbol(sellBar, bars[sellBar].high*1.005, Symbol.Circle, "P",
 BoxAlign.Centre|BoxAlign.Below);
			sellBar = 0;
		}
		else if (sellBar && bars[i].high>openPrice*(1+SL/100))
		{
			setBrushColour(Colour.Red);
			drawSymbol(sellBar, bars[sellBar].high*1.005, Symbol.Circle, "L",
 BoxAlign.Centre|BoxAlign.Below);
			sellBar = 0;
		}
		else if (!buyBar && !sellBar && bars[i-1].high < bars[i-2].high &&
 bars[i-1].low > bars[i-2].low)
		{
			if (bars[i].close>bars[i-1].close && bars[i-2].close > bars[i-3].close)
			{
				bars[i-2].colour = buyCol;
				bars[i-1].colour = buyCol;
				bars[i].colour = buyCol;
				buyBar = i;
				if (i+1<bars.length) var openPrice = bars[i+1].open;
			}
			else if (bars[i].close < bars[i-1].close && bars[i-2].close < bars[i-3].close)
			{
				bars[i-2].colour = sellCol;
				bars[i-1].colour = sellCol;
				bars[i].colour = sellCol;
				sellBar = i;
				if (i+1<bars.length) var openPrice = bars[i+1].open;
			}
		}
	}
}

VT TRADER: THREE-BAR INSIDE BAR PATTERN TRADING SYSTEM
Our Traders’ Tip this month is based on “Three-Bar Inside Bar Pattern” by Johnan Prathap in this issue. In the article, Prathap describes a trading system for finding potential trading opportunities based on three-bar inside bar positive and negative reversal patterns.
We’ll be offering Prathap’s three-bar inside bar pattern trading system for download in our VT client forums at https://forum.vtsystems.com along with hundreds of other precoded and free trading systems. The specific trading rules used by the trading system are explained in its Notes section. The VT Trader instructions for creating the trading system are as follows:
- Ribbon→Technical Analysis menu→Trading Systems group→Trading Systems Builder command→[New] button
- In the General tab, type the following text for each field:
Name: TASC - 03/2011 - 3-Bar Inside Bar Pattern Trading System
Function Name Alias: tasc_3BarInsideBarPatternSystem
Label Mask: TASC - 03/2011 - 3-Bar Inside Bar Pattern Trading System
- In the Input Variable(s) tab, create the following variables:
[New] button... Name: TD , Display Name: Select Trades Allowed... , Type: Enumeration ,
 Default: Bid (Click […] button -> [New] button -> type Buy_Trades_Only;
  [New] button -> type Sell_Trades_Only; [New] button -> type Buy_and_Sell_Trades; [OK] button)
[New] button... Name: SLP , Display Name: Stoploss Percentage , Type: float , Default: 0.75
[New] button... Name: TPP , Display Name: Take Profit Percentage , Type: float , Default: 0.75
- In the Output Variable(s) tab, create the following variables:
[New] button...
Var Name: LongEntryInitialStop
Name: Long Entry Stoploss
* Checkmark: Indicator Output
Select Indicator Output tab
Line Color: blue
Line Width: 2
Ling Style: solid
Placement: Price Frame
[OK] button...


[New] button...
Var Name: LongEntryProfitTarget
Name: Long Entry Limit Profit Target
* Checkmark: Indicator Output
Select Indicator Output tab
Line Color: dark blue
Line Width: 2
Ling Style: solid
Placement: Price Frame
[OK] button...


[New] button...
Var Name: ShortEntryInitialStop
Name: Short Entry Stoploss
* Checkmark: Indicator Output
Select Indicator Output tab
Line Color: red
Line Width: 2
Ling Style: solid
Placement: Price Frame
[OK] button...


[New] button...
Var Name: ShortEntryProfitTarget
Name: Short Entry Limit Profit Target
* Checkmark: Indicator Output
Select Indicator Output tab
Line Color: dark red
Line Width: 2
Ling Style: solid
Placement: Price Frame
[OK] button...


[New] button...
Var Name: LongEntrySignal
Name: Long Entry Signal
* Checkmark: Graphic Enabled
* Checkmark: Alerts Enabled
Select Graphic Bookmark
Font […]: Up Arrow
Size: Medium
Color: Blue
Symbol Position: Below price plot
	Select Alerts Bookmark
		Alert Message: Long Entry Signal
		Alert Sound: ringin.wav
[OK] button...


[New] button...
Var Name: LongExitSignal
Name: Long Exit Signal
* Checkmark: Graphic Enabled
* Checkmark: Alerts Enabled
Select Graphic Bookmark
Font […]: Exit Sign
Size: Medium
Color: Blue
Symbol Position: Above price plot
	Select Alerts Bookmark
		Alert Message: Long Exit Signal
		Alert Sound: ringin.wav
[OK] button...


[New] button...
Var Name: ShortEntrySignal
Name: Short Entry Signal
* Checkmark: Graphic Enabled
* Checkmark: Alerts Enabled
Select Graphic Bookmark
Font […]: Down Arrow
Size: Medium
Color: Red
Symbol Position: Above price plot
	Select Alerts Bookmark
		Alert Message: Short Entry Signal
		Alert Sound: ringin.wav
[OK] button...


[New] button...
Var Name: ShortExitSignal
Name: Short Exit Signal
* Checkmark: Graphic Enabled
* Checkmark: Alerts Enabled
Select Graphic Bookmark
Font […]: Exit Sign
Size: Medium
Color: Red
Symbol Position: Above price plot
	Select Alerts Bookmark
		Alert Message: Short Exit Signal
		Alert Sound: ringin.wav
[OK] button...


[New] button...
Var Name: OpenBuy
Name: Open Buy
* Checkmark: Trading Enabled
Select Trading Bookmark
Trading Action: BUY
Trader's Range: 10
[OK] button...


[New] button...
Var Name: CloseBuy
Name: Close Buy
* Checkmark: Trading Enabled
Select Trading Bookmark
Trading Action: SELL
Trader's Range: 10
[OK] button...


[New] button...
Var Name: OpenSell
Name: Open Sell
* Checkmark: Trading Enabled
Select Trading Bookmark
Trading Action: SELL
Trader's Range: 10
[OK] button...


[New] button...
Var Name: CloseSell
Name: Close Sell
* Checkmark: Trading Enabled
Select Trading Bookmark
Trading Action: BUY
Trader's Range: 10
[OK] button...
- In the Formula tab, copy and paste the following formula:
{Provided By: Visual Trading Systems, LLC} {Copyright: 2011} {Description: TASC, March 2011 - "How It Works On Gold And Silver And Crude; Three-Bar Inside Bar Pattern" by Johnan Prathap} {File: tasc_3BarInsideBarPatternSystem.vttrs - Version 1.0} {Define Final Trade Entry/Exit Criteria} EntryCond1:= C>ref(C,-1); EntryCond2:= H<ref(H,-1) AND L>ref(L,-1); EntryCond3:= C<ref(C,-1); LongEntrySetup:= EntryCond1=1 AND ref(EntryCond2,-1)=1 AND ref(EntryCond1,-2)=1; ShortEntrySetup:= EntryCond3=1 AND ref(EntryCond2,-1)=1 AND ref(EntryCond3,-2)=1; {Long Entry Signal} LongEntrySignal:= ((TD=0 OR TD=2) AND LongTradeAlert=0 AND ShortTradeAlert=0 AND LongEntrySetup=1); {Long Entry Price Simulated Data For Exit Options} LongEntryPrice:= valuewhen(1,LongEntrySignal=1,C); {Long Trade Stoploss} LongEntryInitialStop:= If(LongEntrySignal=1 OR LongTradeAlert=1, LongEntryPrice - valuewhen(1,LongEntrySignal=1,C*(SLP/100)), null); {Long Trade Profit Target} LongEntryProfitTarget:= If(LongEntrySignal=1 OR LongTradeAlert=1, LongEntryPrice + valuewhen(1,LongEntrySignal=1,C*(TPP/100)), null); {Long Exit Signal} LongExitSignal:= (LongTradeAlert=1 AND Cross(LongEntryInitialStop,C)) OR (LongTradeAlert=1 AND Cross(C,LongEntryProfitTarget)); {Short Entry Signal} ShortEntrySignal:= ((TD=1 OR TD=2) AND ShortTradeAlert=0 AND LongTradeAlert=0 AND ShortEntrySetup=1); {Short Entry Price Simulated Data For Exit Options} ShortEntryPrice:= valuewhen(1,ShortEntrySignal=1,C); {Short Trade Stoploss} ShortEntryInitialStop:= If(ShortEntrySignal=1 OR ShortTradeAlert=1, ShortEntryPrice + valuewhen(1,ShortEntrySignal=1,C*(SLP/100)), null); {Short Trade Profit Target} ShortEntryProfitTarget:= If(ShortEntrySignal=1 OR ShortTradeAlert=1, ShortEntryPrice - valuewhen(1,ShortEntrySignal=1,C*(TPP/100)), null); {Short Exit Signal} ShortExitSignal:= (ShortTradeAlert=1 AND Cross(C,ShortEntryInitialStop)) OR (ShortTradeAlert=1 AND Cross(ShortEntryProfitTarget,C)); {Open Trade Determination for Long/Short EntryExit Signals} LongTradeAlert:= SignalFlag(LongEntrySignal,LongExitSignal); ShortTradeAlert:= SignalFlag(ShortEntrySignal,ShortExitSignal); {Create Auto-Trading Functionality; Only used in Auto-Trade Mode} OpenBuy:= LongEntrySignal=1 AND BuyPositionCount()=0; CloseBuy:= LongExitSignal=1 AND BuyPositionCount()>0; OpenSell:= ShortEntrySignal=1 AND SellPositionCount()=0; CloseSell:= ShortExitSignal=1 AND SellPositionCount()>0; - Click the “Save” icon to finish building the trading system.
To attach the trading system to a chart, select the “Add Trading System” option from the chart’s contextual menu, select “TASC - 03/2011 - 3-Bar Inside Bar Pattern Trading System” from the trading systems list, and click the [Add] button.
An example of the trading system plotted on a VT Trader chart is shown in Figure 17.
To learn more about VT Trader, please visit www.vtsystems.com.
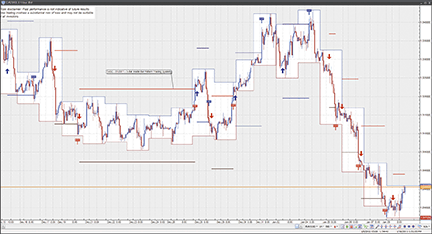
Figure 17: VT TRADER, Inside Bar Pattern TRADING SYSTEM. Here is Johnan Prathap’s three-bar inside bar pattern trading system on a EUR/USD one-hour candlestick chart in VT Trader.
To learn more about VT Trader, please visit www.vtsystems.com.
TRADING BLOX: THREE-BAR INSIDE BAR PATTERN
In “Three-Bar Inside Patterns,” author Johnan Prathap presents a trading pattern for both long and short signals on crude oil, gold, and silver.
This can be implemented in Trading Blox by following the steps below. The system has been slightly modified to set take-profit and stop-loss levels based on volatility (as a percentage of Atr).
- Create a new Blox (Entry, Exit, Money Manager)
- In it, define the Parameters:
- ATR_Period, (number of days to be used to calculate the ATR),
- TP (ATR-multiplier for the Take-Profit price),
- SL (ATR-multiplier for the Stop-Loss price),
- riskPerTrade (Amount of Total Equity to be risked per trade, i.e. heat)
- Define the Indicator: ATR (standard Trading Blox indicator calculation)
- Define the entry logic in the “Entry Orders” script of the block:
'-------------------------------------------------------------------
'Trader's Tips March 2011
'Inside Bars by Johnan Prathap
'Code by Jez Liberty - Au.Tra.Sy
'jez@automated-trading-system.com
'https://www.automated-trading-system.com/

IF instrument.position <> LONG THEN
	IF instrument.close > instrument.close[1] '3rd bar
		AND instrument.high[1] < instrument.high[2] AND instrument.low[1] >
 instrument.low[2] '2nd bar
		AND instrument.close[2] > instrument.close[3] '1st bar
		THEN
			broker.EnterLongOnOpen
	ENDIF
ENDIF

IF instrument.position <> SHORT THEN
	IF instrument.close < instrument.close[1] '3rd bar
		AND instrument.high[1] < instrument.high[2] AND instrument.low[1] >
 instrument.low[2] '2nd bar
		AND instrument.close[2] < instrument.close[3] '1st bar
		THEN
			broker.EnterShortOnOpen
	ENDIF
ENDIF

'---------------------------------------------------------------------
- Define the Exit logic in the “Exit Orders” script of the block:
'-------------------------------------------------------------------
'Trader's Tips March 2011
'Inside Bars by Johnan Prathap
'Code by Jez Liberty - Au.Tra.Sy
'jez@automated-trading-system.com
'https://www.automated-trading-system.com/

IF instrument.position = LONG THEN
	broker.ExitAllUnitsAtLimit(instrument.tradeEntryFill + TP * ATR)
	print instrument.tradeEntryFill, instrument.tradeEntryFill + TP * ATR
	broker.ExitAllUnitsOnStop (instrument.tradeEntryFill - SL * ATR)
ENDIF

IF instrument.position = SHORT THEN
	broker.ExitAllUnitsAtLimit(instrument.tradeEntryFill - TP * ATR)
	broker.ExitAllUnitsOnStop (instrument.tradeEntryFill + SL * ATR)
ENDIF


'---------------------------------------------------------------------
- Define the Position Sizing in the “Unit Size” script of the block:
'-------------------------------------------------------------------
'Trader's Tips March 2011
'Inside Bars by Johnan Prathap
'Code by Jez Liberty - Au.Tra.Sy
'jez@automated-trading-system.com
'https://www.automated-trading-system.com/

VARIABLES: riskEquity, dollarRisk TYPE: money

' Compute the risk equity.
riskEquity = system.tradingEquity * riskPerTrade

' Compute the dollar risk.
dollarRisk = SL * ATR * instrument.bigPointValue

' Set the trade size.
IF dollarRisk = 0 THEN
	order.SetQuantity( 0 )
ELSE
	order.SetQuantity( riskEquity / dollarRisk )
ENDIF

' Reject the order if the quantity is less than 1.
IF order.quantity < 1 THEN
	order.Reject( "Order Quantity less than 1" )
ENDIF

'---------------------------------------------------------------------
The code can be downloaded from https://www.automated-trading-system.com/free-code/.
Figure 18 shows an example of the system used on crude oil, gold, and silver from 1990 to 2010, with Atr being calculated on 39 days; take-profit and stop-loss being at 1 Atr; and risk per equity for each trade at 1%.
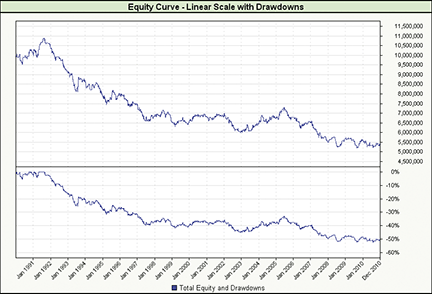
FIGURE 18: Trading Blox, Three-Bar Inside Bar PatterN. Here is a sample equity curve for the system.
Note that there might be some issues when testing this sort of system on daily data: If the take-profit and stop-loss prices are both within the range of a single bar, it is not possible to know which one occurs first. A pessimistic approach would always pick the stop-loss, whereas an (over)optimistic approach would pick the take-profit.
MICROSOFT EXCEL: THREE-BAR INSIDE BAR STUDY
The logic presented in the sample code given in Johnan Prathap’s article in this issue, “Three-Bar Inside Bar Pattern,” is straightforward and requires nothing beyond the capabilities of Excel cell formulas.
The entry signals for potential transactions are locked down by Prathap’s three-bar setup logic and do not change for different data sets. The question of which entry signals are actually used for trades is completely controlled by whether a transaction is already in flight.
Transaction duration is directly controlled by the exit condition specifications, which are user controls in Prathap’s example and also in this spreadsheet.
It is interesting to have the chart tab visible, tiled to the bottom of the screen, with the computation and exit controls tab tiled and visible in the upper half of the screen so that you can see the chart while you change exit controls settings.
Model profitability is sensitive even to slight changes to the exit controls, as reflected in the running account balance column.
To download the spreadsheet, right-click on “Three-BarInsideBarPattern.xls” and select “Save Target As.”
A sample chart output from the Excel spreadsheet is shown in Figure 19.
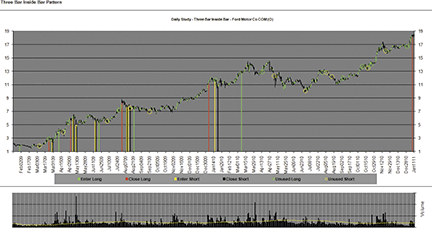
FIGURE 19: EXCEL, Three-Bar Inside Bar Pattern. Here is an example of the system implemented in Excel on Ford Motor Co.

EASYLANGUAGE — PRATHAP ARTICLE CODE
I tested this setup on daily data from May 2001 to August 2010 on three major commodities: gold, silver, and crude oil. The results are worth some consideration.
EASYLANGUAGE CODE FOR THREE-BAR INSIDE BAR

Input: Tr(0.75), Sl(0.75);

Condition1 = Close > Close[1];
Condition2 =  High < High[1] AND Low > Low[1] ;
Condition3 = Close < Close[1];

vars: mp(0);

mp = marketposition;

If mp = 0 then begin
	If Condition1 and condition2[1] and Condition1[2] then Buy next bar at Open;
	If Condition3 and condition2[1] and Condition3[2] then Sell Short next bar at Open;
end;

If marketposition = 1 then begin
	Sell next bar at entryprice+(entryprice*Tr/100) Limit;
	Sell next bar at entryprice-(entryprice*Sl/100) stop;
end;

If marketposition = -1 then begin
	Buy to Cover next bar at entryprice-(entryprice*Tr/100) Limit;
	Buy to Cover next bar at entryprice+(entryprice*Sl/100) stop;
end;