AT THE CLOSE
Trading Time Frames In Forex
A five-minute chart and a one-hour chart can tell you very different things about the same tradable. Which one is right for you?
Those who are new to forex trading never realize how dramatically different things look when they simply change the time frame. A standard time frame for almost any chart will either be a one-hour or a five-minute time frame. Neither chart will look the same, even though the prices will be exactly the same. There is no better way to illustrate this point than to view two drastically different charts. The currency pair would be the same, but the charts tell a very different story.
In Figure 1, you see a five-minute chart of the Eur/Usd for July 7, 2011. There are no other indicators or lines of any kind except the line drawn by the software that points out a level of resistance at 1.4362. By looking at this chart we can see a strong move to the upside has just occurred. Price is currently testing its resistance level.
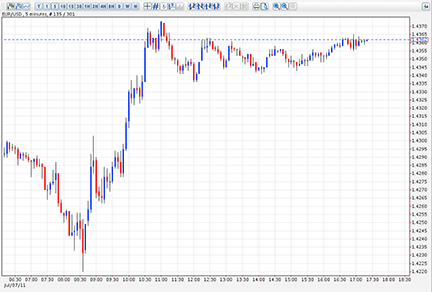
Figure 1: FIVE-minute chart of eur/usd (july 7, 2011). All you see here is a resistance level at 1.4362. You can see that a strong move to the upside has just occurred.
The one-hour chart of the same currency pair in Figure 2 is a different picture indeed. The software drew a line along the 1.4361 level almost exactly the same as the 1.4362 line of resistance it drew on the five-minute chart. Clearly, the Eur/Usd has been in the midst of a downtrend since July 3, 2011.
While the differences between the five-minute and one-hour chart are noticeable immediately, the reason may not be. We need a better understanding of these time frames.