CHARTING
Stocks With Problems
Falling Off A Cliff
Spot a disaster stock before disaster strikes.
For an investor, there is nothing worse than holding on to a stock and watching its price just keep going down. The news may be good, revenues may be growing, and the company’s profitability may be encouraging. So what is going on? Not too long ago, investors could hold on through bull and bear markets to stocks that rewarded their loyalty by returning to their bull market highs once the bear got tired. They could hold on to those glamour or blue-chip stocks because those tradables would always come back. And as they waited patiently for their stocks to come back, investors would always count on those dividends. One way or another, they couldn’t lose.
But times, they are changing
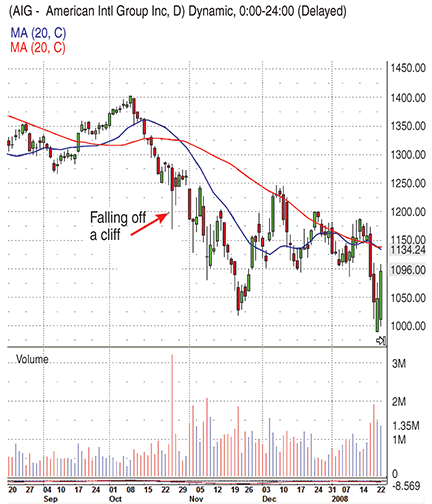
American International Group (Aig) was such a stock. From 1984 the stock exploded to a high of $157.19 in July 1997 after splits. Aig has paid dividends from 1992 to 2008, with yields averaging 8.9% from 2000 to 2006.
Then there was Citigroup (C). The merger between Citicorp, the holding company of Citibank, and Travelers Group in 1998 created a $140 billion firm with assets of almost $700 billion. Although C had not displayed spectacular performance through the years, investors could rely on their dividends, which were paid every year from 1988 to 2007, with an average yield of 1.4% over the 1988–2007 period.

Figure 1: daily chart of aig. The daily volume between October 9 and November 21, 2007, was heavier than during previous months. The average daily volume during that period was 1,062,828, compared to the previous 12 months’ average daily volume of 509,327. Average volume during the last week of the pattern was even higher.