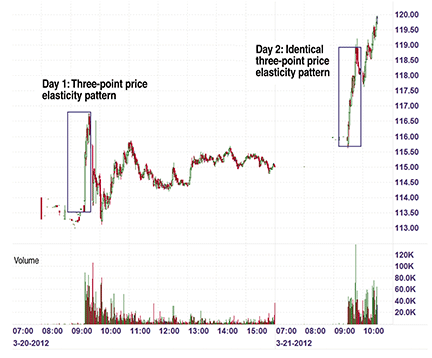
FIGURE 1: INTRADAY PRICE ELASTICITY. On this chart of Netflix (NFLX) you see that three-point moves are typical of NFLX’s opening range breakouts on each of these two trading days.
DAYTRADING
Managing Intraday Trade Entries
Here’s how to recognize specific patterns that can be incorporated into a successful trading strategy.
Entering daytrades using well-defined technical signals is often based on specific price-based patterns. One of the most valuable daytrading tactics is using price volatility breakouts, which is defined as using the length of single price action moves to help determine trading entries. For example, the height of a specific cup pattern and percentages of the average trading range (ATR) are integral parts of daytrading strategies used by experienced traders when trading specific price volatility patterns.
Daytrading price extensions
Understanding specific price elasticity patterns is a key to precise daytrading because the most recent price elasticity (in both a full day’s average range as well as the depth of cups) is the best predictor of future price action. For example, in the two-day Netflix (NFLX) chart in Figure 1, you can see that on March 20, 2012, the opening range breakout range was exactly three points (116.7–113.7). On the following day, the opening range price extension was an identical three-point range (115.8 to 118.8).
Armed with this information, an astute daytrader would know to scale into a trade during the initial three-point run. He or she would also know to tighten in a trailing stop as the trade reaches the three-point price extension area during the second day in which this pattern is observed.
This type of price volatility breakout pattern recognition skill is part of what makes pattern daytrading a potentially successful technical trading strategy. The more often these microprice patterns are observed, the better our understanding of the volatility, and thus the more knowledge that a trader can gain about the instrument being traded.
To use this technical daytrading strategy effectively, traders should gain a specific understanding of three critical price volatility patterns.

FIGURE 1: INTRADAY PRICE ELASTICITY. On this chart of Netflix (NFLX) you see that three-point moves are typical of NFLX’s opening range breakouts on each of these two trading days.