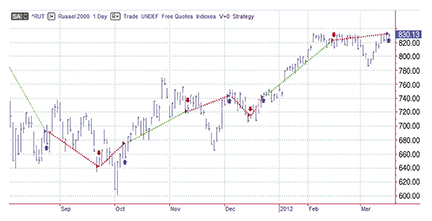
FIGURE 1: DOES THE SYSTEM WORK? On this daily chart of the Russell 2000 (August 2011–March 2012) you see the buy & sell arrows of an MACD trading system. Just by looking at the buy & sell arrows, it appears as if the system works well.
TRADING SYSTEMS
An Introduction
To become a proficient trader you need to test and confirm your ideas before placing a trade. But how do you go about doing that? Here are the first steps you need to take when you’re designing a trading system.
I have been trading for more than 30 years. I have been designing and testing trading systems for 30 years as well. In this article and the ones that follow, I will cover system design and testing. We will go through the entire process in detail, so you can see what it takes to become a proficient trader. You cannot simply get up one morning and decide that you are a trader; you must do the homework, the study, the grueling process of testing, and confirming your ideas before putting real money after those ideas. Otherwise, you are liable to lose everything.
Through these articles, I will use several different software products for my charts, figures, and illustrations. Rather than make the articles all about one program, I will be using several. The concepts apply equally well to them all.
Design and testing of systems is tedious at best and grueling at worst. In fact, maybe the worst would be never finding a system that works the way you want it to.
Testing used to be even worse. When I first began researching and testing trading systems, I had to do it with pencil and paper and a calculator. Then came Excel and spreadsheet math, which was much easier. Eventually, SystemWriter, the predecessor to TradeStation, was invented, and then it was off to the races. What used to take me months now only takes days to find out if my system works. So what does “works” mean in this case?
What does it mean?
As far as a system is concerned, for these articles, a system “works” when it makes a profit. It could mean that the system places buy & sell arrows on a chart. But as far as I am concerned, “works” means that a system is profitable. Figure 1 works as far as arrows go. But as you will see from Figure 2, it doesn’t work as far as profit goes.

FIGURE 1: DOES THE SYSTEM WORK? On this daily chart of the Russell 2000 (August 2011–March 2012) you see the buy & sell arrows of an MACD trading system. Just by looking at the buy & sell arrows, it appears as if the system works well.