CHARTING
Trading The Trend
SwamiCharts Convolution
by John F. Ehlers and Ric Way
One of the major objectives of technical analysis is to decisively identify a major reversal so that we can trade the market primarily in the direction of the ensuing trend. SwamiCharts convolution is just the ticket to meet that objective.
In mathematics jargon, “convolution” is an operation on two functions that produces a third function. Convolution is similar to cross-correlation between the two input functions — with a twist. An anachronistic term for convolution is faltung, which means “folding” in German. It is this concept that makes convolution useful for trading. Here, we will spare you the details of the mathematics and jump from the theoretical concept to useful trading examples.
Theoretical foundation
Consider what happens at an idealized market bottom. The prices decrease linearly until the bottom is reached and then increase linearly after the bottom has occurred. If we fold these idealized prices about the market bottom, the two price segments are perfectly correlated. We have cross-correlated two market segments that have been folded at the horizontal point of the market bottom. This correlation only occurs at the idealized market bottom that, in fact, establishes the need for prefiltering before the correlation is calculated so that a relatively high correlation can be achieved using real data.
Figure 1 shows two graphic examples of convolution in an initial uptrend. In the left-hand case, the folding has been done in the middle of a continuing trend. The result is that the two price segments are not correlated after the folding operation. If the folding is done at exactly the market peak, as shown in the right-hand case, the two price segments are exactly correlated after the folding operation.
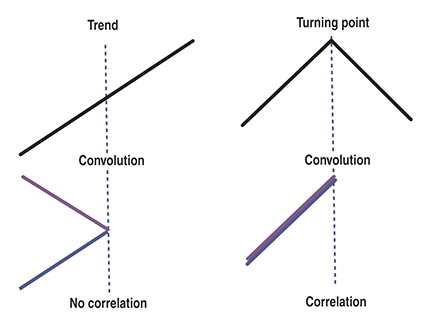
FIGURE 1: CONVOLUTION IN AN INITIAL UPTREND. High correlations occur only at major market turning points. In the diagram on the left-hand side, the folding was done in the middle of a continuing trend. The two segments are not correlated after the folding operation. On the right-hand side, the folding is done at exactly the market peak. The two price segments are exactly correlated after the folding operation.
Since high correlation only exists at the market turning point, the convolution indicator is dependent upon the lookback period used in the calculation. Assuming the two price segments have equal time duration, the peak correlation occurs at half the lookback period of the indicator. For example, if a 13-bar period is used, the market peak would appear with a seven-bar delay. The same market peak would appear with a 19-bar delay if a 39-bar lookback period were used in the convolution computation.
Excerpted from an article originally published in the October 2012 issue of Technical Analysis of Stocks & Commodities magazine. All rights reserved. © Copyright 2012, Technical Analysis, Inc.
Return to Contents