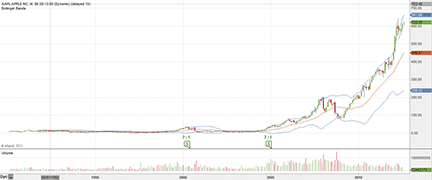
FIGURE 1: AAPL SINCE 1982. The price of the stock has gone up about 300 times.
INTERVIEW
The Markets Through Time

Stock market expert Marc Chaikin founded Chaikin Stock Research to deliver professional-quality stock research and investing resources to help self-directed investors invest with the same edge as the pros. A trader, broker, and fundamental and quantitative analyst during a 40-year Wall Street career (and a previous S&C interview subject), Chaikin invented three technical trading indicators: the widely used Chaikin oscillator, the Chaikin accumulation/distribution indicator, and the Chaikin persistency of money flow, which is the basis of Investor’s Business Daily’s accumulation/distribution rating. His indicators’ predictive value has made them standards in most technical analysis software packages.
Chaikin also developed computerized stock selection models for professional money managers and individual investors. He pioneered and created the first real-time analytics workstation for portfolio managers and stock traders, now part of Thomson Reuters’ institutional workstation. He appears as a stock market expert on CNBC, Bloomberg, and Fox Business News, has lectured worldwide, and was recently named one of the “Top Wall Street Experts and Opinion Leaders” by WallStreetEconomist.org.
Stocks & Commodities Editor Jayanthi Gopalakrishnan spoke with Marc Chaikin on August 3, 2012.
Marc, I looked over the interview that S&C did with you back in 1993 or 1994, and right off the bat it was interesting in and of itself because you mentioned that the day you got your stockbroker’s license was the day that the bear market of 1966 ended.
It was!
That must have been a pretty exciting time for you.
It was exciting and it also made the whole process of investing and trading look easy, because everything went up for the first two years in my career. But a new bear market started in February 1969 and suddenly things weren’t so easy any more. That was when I started getting serious about technical analysis research.
The bear market that started a few years after you got your license is what led you to explore technical analysis?
Technical indicators are based on human nature and that has not changed, whether you were trading in the 1920s or now.Exactly. I had looked at technical analysis earlier than that, but it wasn’t that important because everything was going up and the firm I was with — which was Shearson Hammill back then, one of the predecessors of Morgan Stanley Smith Barney today — had a great fundamental research department.
I started following the firm’s research in a bull market and my clients did very well. The problem was that as the bear market started to unfold, all of these fundamental analysts kept reiterating their buy recommendations as stocks dropped from 100 to 15. Somewhere near the bottom they finally threw in the towel. I realized this was not the way to build a career. So then I got serious about technical analysis.
But how was the field of technical analysis doing at that time? It could not have been looked upon that highly.
Not at all. In fact, when I was at the main office of Shearson, you had to keep your chartbooks in a drawer. If you had them out, the manager of the office would come around and say, “Put that away. This is a fundamental research firm.” We used to get charts from Standard & Poor’s, or some of the early chart services. Mansfield had a chart service back then. It was frowned upon. Nobody acknowledged that they were using charts, although it turned out that institutional money managers like Jerry Tsai and some of the people at Fidelity were using charts, but they didn’t talk about it.

FIGURE 1: AAPL SINCE 1982. The price of the stock has gone up about 300 times.