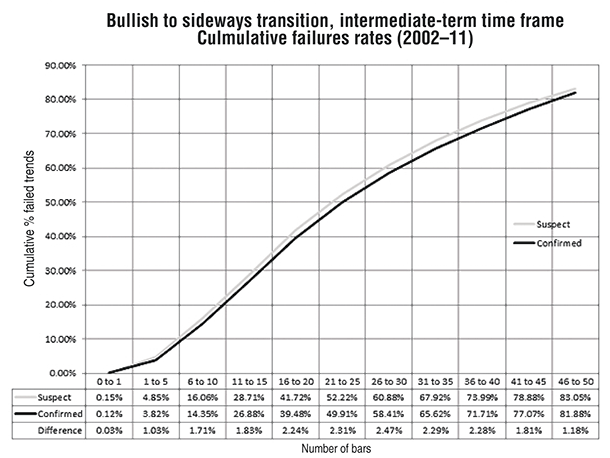
FIGURE 1: MEAN TIME TO FAILURE (MTTF) FOR A BULLISH TREND ON THE SHORT-TERM TIME FRAME. Here you see the cumulative probability failure rates for both suspect and confirmed bullish trends on this time frame.
MODIFIED METHODS
The Big Question
All trends begin and eventually end, but the rate at which they end is not the same across all time frames. Find out how incorporating trend failure rates into your trading can make you a more effective trader.
Time is the hardest element to integrate with technical trading. After studying many ways that others have attempted to do this, I somehow felt they were lacking and still wanted to take it further.
In most engineering disciplines, you’ll come across the concept of measuring a product’s useful life cycle. It is often referred to as the mean time to failure (MTTF). Essentially, it’s an estimate of the average, or mean time until product failure. It is a useful measure and is drawn from a representative sample set of the population under study, whatever that may be.
MEAN TIME TO FAILURE?
Some common, everyday examples of objects with MTTF rates include your washing machine, your microwave oven, or the toaster sitting on your countertop. All have a useful life cycle and in all cases, that expected life cycle is estimable. They come off the factory floor, are purchased, and then serve their owner for some useful period of time before breaking and being retired.
In my book Trend Qualification And Trading, I outlined a neoclassical methodology centered on the notion that not all trends are created equal. This conclusion was reached after I systematically studied thousands of trading instruments across multiple time frames in an automated fashion. I then examined the probability of the trend continuing based on various attributes I observed. The most interesting attribute where a correlation was clearly observable was related to volume characteristics. Volume confirmation (confirmed trend) or nonconfirmation (suspect trend) at the time of a trend’s transition led to an increased or decreased probability of trend continuance.

FIGURE 1: MEAN TIME TO FAILURE (MTTF) FOR A BULLISH TREND ON THE SHORT-TERM TIME FRAME. Here you see the cumulative probability failure rates for both suspect and confirmed bullish trends on this time frame.