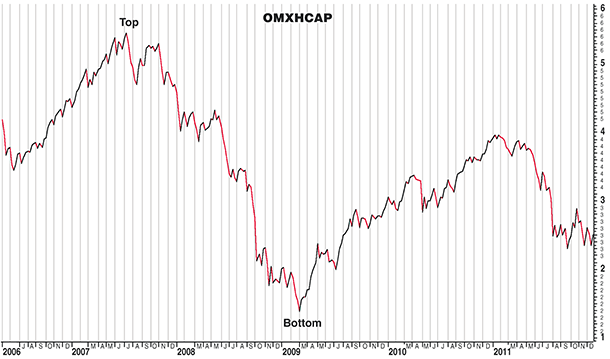
FIGURE 1: A LONG-TERM VIEW. The market reached a top on July 16, 2007, and a bottom on March 9, 2009.
INDICATORS
Follow The Leaders
Here’s a unique look at how you can identify market turning points.
Identifying the beginning of a trend or foreseeing when a trend is about to start is on every trader’s wish list. Being able to do this would help optimize the timing of when to shift from stocks to cash and equivalents ahead of bearish turns, and from cash to stocks ahead of bullish turns.
Predicting market turning points will always be a topic of interest among traders and investors. It will remain a challenge and will never be completely achievable. However, in order to gain some ability to anticipate potential turning points in a prevailing market trend, it is helpful to identify the processes that affect these trend turnings.
IS VOLATILITY A GOOD MEASURE OF RISK?
Typically, at the end of a bullish regime, investors start to reexamine their risk exposure in stocks. This decreases the demand of the stock at current prices. The supply increases, exceeds demand, and prices start to fall — and markets turn bearish.
This may lead you to think that monitoring market risk measures is the key to anticipating turns in trends. But risk is an elusive concept and difficult to capture. It is usually measured by subjective means, often by volatility calculated from daily returns. But using volatility as a risk measure can be a problem because it gauges variation in stock prices. Hence, critical risks may not show up in the amount of volatility, even if the markets have priced in the risks.
Risk, theoretically, is associated with the probability of an unpleasant outcome (potential losses themselves are called risks). But probabilities are not visible in real life. They can’t be observed until they are realized in concrete terms such as monetary losses. Because volatility cannot fully capture the invisible probabilities, simple risk monitoring by volatility is not adequate to anticipate market turnings. It is better to turn to other tools.
FIGURE 1: A LONG-TERM VIEW. The market reached a top on July 16, 2007, and a bottom on March 9, 2009.