TRADERS’ TIPS
July 2013
For this month’s Traders’ Tips, the focus is Sylvain Vervoort’s article in this issue, “The Step Candle Pattern.” Here we present the July 2013 Traders’ Tips code with possible implementations in various software.
Code for NinjaTrader is already provided in Vervoort’s article. Subscribers will find that code at the Subscriber Area of Traders.com. (Click on “Article Code” from our homepage.) Presented here is an overview of possible implementations for other software.
Traders’ Tips code is provided to help the reader implement a selected technique from an article in this issue. The entries are contributed by various software developers or programmers for software that is capable of customization.

TRADESTATION: JULY 2013 TRADERS’ TIPS CODE
In “The Step Candle Pattern” in this issue, author Sylvain Vervoort adds candle-pattern detection to the swing trading strategy he has been presenting in his recent article series. This follows the high-low zigzag component he introduced last month in his June 2013 article, and which was the Traders’ Tips topic of that issue.
The candlestick patterns that Vervoort introduces this issue include the upstep, downstep, GapUp, GapDown, engulfing, and harami pattern. The EasyLanguage code we’re providing looks for these patterns occurring at the pivot points detected by the zigzag calculation discussed last month. Each individual pattern can be enabled or disabled. Trend changes coincident with candle patterns represent trading signals.
We have incorporated these rules in a strategy available on our website. The code we’re providing is for an indicator that draws the zigzag lines and pivots identified with candle patterns. Inputs were coded to allow for adjustment of several calculation parameters as well as the color and thickness of the trendlines drawn on the chart.
To download the EasyLanguage code, first navigate to the EasyLanguage FAQs and Reference Posts Topic in the EasyLanguage support forum (https://www.tradestation.com/Discussions/Topic.aspx?Topic_ID=47452), scroll down, and click on the link labeled “Traders’ Tips, TASC.” Then select the appropriate link for the month and year. The ELD filename is “__SVCandlePattern.ELD.”
The code is also shown below.
_SVCandlePattern (Indicator)
{ TASC Article, Jul 2013 }
{ "The Step Candle Pattern" }
{ Indicator Code }
{ Sylvain Vervoort }

using elsystem ;
using elsystem.collections ;

inputs:
    double ZZPercent( 5 ), { 0 = no influence;
    enter in percentage points; for 1%
     enter 1, Not 0.01  }
    int ATRPeriod( 5 ), { number of bars for
    ATRCalc calc }
    double ATRFactor( 1.5 ), { 0 = no ATR
    influence }
    int ZigZagColor( Cyan ), { trendline
    color }
    int LineWidth( 1 ), { trendline
    thickeness }
    int CandlePattern( 9 ),
    bool Search2ndBar( true ),
    int BullTextColor( Green ),
    int BearTextColor( Red ) ;
variables:
    double ATRCalc( 0 ),
    intrabarpersist int trend( 1 ), { confirmed
    trend of current zigzag, 1 = up,
     -1 = down (assume trend is up at the start) }
    int LHBDate( 0 ),
    int LHBTime( 0 ),
    intrabarpersist int uplineid( 0 ),
    int LLBDate( 0 ),
    int LLBTime( 0 ),
    intrabarpersist int downlineid( 0 ),
    intrabarpersist double HH( 0 ),
    intrabarpersist double LL( 0 ),
    intrabarpersist double HLPivot( 0 ),
    double PriorBodyHigh( 0 ),
    double PriorBodyLow( 0 ),
    double CurrentBodyHigh( 0 ),
    double CurrentBodyLow( 0 ),
    bool UpStepBar( false ),
    bool DnStepBar( false ),
    bool BodyGapUp( false ),
    bool BodyGapDn( false ),
    bool EngulfBar( false ),
    bool HaramiBar( false ),
    bool BullPatternFound( false ),
    bool BearPatternFound( false ),
    string DateString( " " ),
    int NextLHBDate( 0 ),
    int NextLHBTime( 0 ),
    int NextLLBDate( 0 ),
    int NextLLBTime( 0 ),
    Dictionary UpStepDict ( NULL ),
    Dictionary DnStepDict ( NULL ),
    Dictionary GapUpDict ( NULL ),
    Dictionary GapDnDict ( NULL ),
    Dictionary EngulfDict ( NULL ),
    Dictionary HaramiDict ( NULL ) ;

#region DrawingMethods
method void DrawUpLine()
    begin
    uplineid = TL_New( LLBDate, LLBTime, LL,
    LHBDate, LHBTime, HH ) ;
    FormatTL( uplineid ) ;
    end ;

method void DrawDnLine()
    begin
    downlineid = TL_New( LHBDate, LHBTime, HH,
    LLBDate, LLBTime, LL ) ;
    FormatTL( downlineid ) ;
    end ;

method void DrawText( int MyDate, int MyTime,
double Price, string MyString, int Color,
int Location )
    begin
    value1 = Text_New( MyDate, MyTime,
    Price, MyString ) ;
    Text_SetColor( Value1, Color ) ;
    Text_SetStyle( Value1, 2, Location ) ;
    end ;

method void FormatTL( int TLID )
    begin
    TL_SetColor( TLID, ZigZagColor ) ;
    TL_SetSize( TLID, LineWidth ) ;
    end ;
#endRegion

#region DictSearch
method bool SearchBullishDicts( int MyDate,
int MyTime, double Price, int PatternFilter )
    variables: string LocalDateString,
    bool PatternFound ;
    begin
    LocalDateString = NumToStr( MyDate, 0 )
    + NumToStr( MyTime, 0 ) ;
    PatternFound = false ;
    if PatternFilter = 9 then
        begin
        if UpStepDict.Contains( LocalDateString )
        then
            begin
            DrawText( MyDate, MyTime, Price,
            UpStepDict.Items[LocalDateString]
            astype string, BullTextColor, 0 ) ;
            PatternFound = true ;
            end
        else if GapUpDict.Contains( LocalDateString )
        then
            begin
            DrawText( MyDate, MyTime, Price,
            GapUpDict.Items[LocalDateString]
            astype string, BullTextColor, 0 ) ;
            PatternFound = true ;
            end
        else if
        EngulfDict.Contains( LocalDateString ) then
            begin
            DrawText( MyDate, MyTime, Price,
            EngulfDict.Items[LocalDateString]
            astype string, BullTextColor, 0 ) ;
            PatternFound = true ;
            end
        else if
        HaramiDict.Contains( LocalDateString ) then
            begin
            DrawText( MyDate, MyTime, Price,
            HaramiDict.Items[LocalDateString]
            astype string, BullTextColor, 0 ) ;
            PatternFound = true ;
            end ;
        end
    else if PatternFilter = 1 then
        begin
        if UpStepDict.Contains( LocalDateString )
        then
            begin
            DrawText( MyDate, MyTime, Price,
            UpStepDict.Items[LocalDateString]
            astype string, BullTextColor, 0 ) ;
            PatternFound = true ;
            end
        else if GapUpDict.Contains( LocalDateString )
        then
            begin
            DrawText( MyDate, MyTime, Price,
            GapUpDict.Items[LocalDateString]
            astype string, BullTextColor, 0 ) ;
            PatternFound = true ;
            end ;
        end
    else if PatternFilter = 2 then
        begin
        if EngulfDict.Contains( LocalDateString )
        then
            begin
            DrawText( MyDate, MyTime, Price,
            EngulfDict.Items[LocalDateString]
            astype string, BullTextColor, 0 ) ;
            PatternFound = true ;
            end ;
        end
    else if PatternFilter = 3 then
        begin
        if HaramiDict.Contains( LocalDateString )
        then
            begin
            DrawText( MyDate, MyTime, Price,
            HaramiDict.Items[LocalDateString]
            astype string, BullTextColor, 0 ) ;
            PatternFound = true ;
            end ;
        end ;

    return PatternFound ;
    end ;


method bool SearchBearishDicts( int MyDate,
int MyTime, double Price, int PatternFilter )
    variables: string LocalDateString,
    bool PatternFound ;
    begin
    LocalDateString = NumToStr( MyDate, 0 )
    + NumToStr( MyTime, 0 ) ;
    PatternFound = false ;
    if PatternFilter = 9 then
        begin
        if DnStepDict.Contains( LocalDateString )
        then
            begin
            DrawText( MyDate, MyTime, Price,
            DnStepDict.Items[LocalDateString]
            astype string, BearTextColor, 1 ) ;
            PatternFound = true ;
            end
        else if GapDnDict.Contains( LocalDateString )
        then
            begin
            DrawText( MyDate, MyTime, Price,
            GapDnDict.Items[LocalDateString]
            astype string, BearTextColor, 1 ) ;
            PatternFound = true ;
            end
        else if EngulfDict.Contains( LocalDateString )
        then
            begin
            DrawText( MyDate, MyTime, Price,
            EngulfDict.Items[LocalDateString]
            astype string, BearTextColor, 1 ) ;
            PatternFound = true ;
            end
        else if
        HaramiDict.Contains( LocalDateString ) then
            begin
            DrawText( MyDate, MyTime, Price,
            HaramiDict.Items[LocalDateString]
            astype string, BearTextColor, 1 ) ;
            PatternFound = true ;
            end ;
        end
    else if PatternFilter = 1 then
        begin
        if DnStepDict.Contains( LocalDateString )
        then
            begin
            DrawText( MyDate, MyTime, Price,
            DnStepDict.Items[LocalDateString]
            astype string, BearTextColor, 1 ) ;
            PatternFound = true ;
            end
        else if GapDnDict.Contains( LocalDateString )
        then
            begin
            DrawText( MyDate, MyTime, Price,
            GapDnDict.Items[LocalDateString]
            astype string, BearTextColor, 1 ) ;
            PatternFound = true ;
            end ;
        end
    else if PatternFilter = 2 then
        begin
        if EngulfDict.Contains( LocalDateString )
        then
            begin
            DrawText( MyDate, MyTime, Price,
            EngulfDict.Items[LocalDateString]
            astype string, BearTextColor, 1 ) ;
            PatternFound = true ;
            end ;
        end
    else if PatternFilter = 3 then
        begin
        if HaramiDict.Contains( LocalDateString )
        then
            begin
            DrawText( MyDate, MyTime, Price,
            HaramiDict.Items[LocalDateString]
            astype string, BearTextColor, 1 ) ;
            PatternFound = true ;
            end ;
        end ;
    return PatternFound ;
    end ;
#endregion

once
    begin
    UpStepDict = new Dictionary ;
    DnStepDict = new Dictionary ;
    GapUpDict = new Dictionary ;
    GapDnDict = new Dictionary ;
    EngulfDict = new Dictionary ;
    HaramiDict = new Dictionary ;

    if ATRPeriod <= 0 then
        RaiseRuntimeError( "ATRPeriod input "
        + "must be greater than 0." ) ;
    LLBDate = Date ;
    LLBTime = Time ;
    LHBDate = Date ;
    LHBTime = Time ;
    LL = Low ;
    HH = High ;
    end ;

ATRCalc = AvgTrueRange( ATRPeriod ) ;
DateString = NumToStr( Date, 0 ) +
NumToStr( Time, 0 ) ;
PriorBodyHigh = MaxList( Open[1], Close[1] ) ;
PriorBodyLow = MinList( Open[1], Close[1] ) ;
CurrentBodyHigh = MaxList( Open, Close ) ;
CurrentBodyLow = MinList( Open, Close ) ;
if ATRFactor = 0 then
{ only use percent setting }
    HLPivot = ZZPercent * 0.01
else if ZZPercent = 0 then { only use ATR }
    HLPivot = ATRCalc / Close * ATRFactor
else { use ATR and ZZPercent }
    HLPivot = ZZPercent * 0.01
    + ATRCalc / Close * ATRFactor ;

#region FindPatterns
// Check for bar patterns
// and load dictionaries

// Check if Up Step Bar
// if found update dictionary
UpStepBar = Open >= PriorBodyLow and
            Open < PriorBodyHigh and
            Close > PriorBodyHigh ;

if UpStepBar then
    UpStepDict.Items[ DateString ] =
    "U" astype string ;


// Check if Down Step Bar
// if found update dictionary
DnStepBar = Open <= PriorBodyHigh and
            Open >  PriorBodyLow and
            Close < PriorBodyLow ;
if DnStepBar then
    DnStepDict.Items[ DateString ] =
    "D" astype string ;


// Check if Gap Up Bar
// if found update dictionary
BodyGapUp = Open < Close and
            Open > PriorBodyHigh ;
if BodyGapUp then
    GapUpDict.Items[ DateString ] =
    "GU" astype string ;


// Check if Gap Down Bar
// if found update dictionary
BodyGapDn = Open > Close and
            Open < PriorBodyLow ;
if BodyGapDn then
    GapDnDict.Items[ DateString ] =
    "GD" astype string ;


// Check if Engulfing Bar
// if found update dictionary
EngulfBar = CurrentBodyHigh >= PriorBodyHigh and
            CurrentBodyLow <= PriorBodyLow and
            AbsValue( Open[1] - Close[1] )
            < AbsValue( Open - Close ) ;
if EngulfBar then
    EngulfDict.Items[ DateString ] =
    "E" astype string ;


// Check if Harami Bar
// if found update dictionary
HaramiBar = CurrentBodyHigh <= PriorBodyHigh and
            CurrentBodyLow >= PriorBodyLow and
            AbsValue( Open[1] - Close[1] )
            > AbsValue( Open - Close ) ;
if HaramiBar then
    HaramiDict.Items[ DateString ] =
    "H" astype string ;

#endregion

{ look for swing points and draw lines }
if trend > 0 then { trend is up, look
for new swing low }
    begin
    if High >= HH then { new higher high detected }
        begin
        HH = High ;
        LHBDate = Date ;
        LHBTime = Time ;
        if uplineid <> 0 then
            TL_Delete( uplineid ) ;
        DrawUpLine() ;
        end
    else if Low < HH - HH * HLPivot then { found a
    swing low }
        begin
        LL = Low ;
        LLBDate = Date ;
        LLBTime = Time ;
        trend = -1 ;
        DrawDnLine() ;
        end ;
    end
else { trend is down, look for new swing high }
    begin
    if Low <= LL then { new lower low detected }
        begin
        LL = Low ;
        LLBDate = Date ;
        LLBTime = Time ;
        if downlineid > 0 then
            TL_Delete( downlineid ) ;
        DrawDnLine() ;
        end
    else if High > LL + LL * HLPivot then { found a
    swing high }
        begin
        HH = High ;
        LHBDate = Date ;
        LHBTime = Time ;
        trend = 1 ;
        DrawUpLine() ;
        end ;
    end ;


// if we have a new LLB or LHB on last bar
// Save the date and time of the next bar
// so we can search for pattern there if
// needed
if Date[1] = LHBDate and Time[1] = LHBTime then
    begin
    NextLHBDate = Date ;
    NextLHBTime = Time ;
    end ;

if Date[1] = LLBDate and Time[1] = LLBTime then
    begin
    NextLLBDate = Date ;
    NextLLBTime = Time ;
    end ;

// if we have a trend change look for a pattern
// at the pivot or the next bar.
if Trend > Trend[1] then
    begin
    BullPatternFound = SearchBullishDicts( LLBDate,
    LLBTime, LL, CandlePattern ) ;
    if BullPatternFound = false and
    Search2ndBar then
        BullPatternFound = SearchBullishDicts(
        NextLLBDate, NextLLBTime, LL,
        CandlePattern ) ;
    end
else if Trend < Trend[1] then
    begin
    BearPatternFound = SearchBearishDicts( LHBDate,
    LHBTime, HH, CandlePattern ) ;
    if BearPatternFound = false and Search2ndBar
    then
        BearPatternFound = SearchBearishDicts(
        NextLHBDate, NextLHBTime, HH,
        CandlePattern ) ;
    end ;

// Paint bar where trend changes
if Trend <> Trend[1] then
    begin
    if Trend > 0  then
        begin
        Plot1( High, "BullH", green ) ;
        Plot2( Low, "BullL", green ) ;
        end ;
    if  Trend < 0 then
        begin
        Plot3( High, "BearH", Red ) ;
        Plot4( Low, "BearL", Red ) ;
        end ;

    end ;
A sample chart is shown in Figure 1.
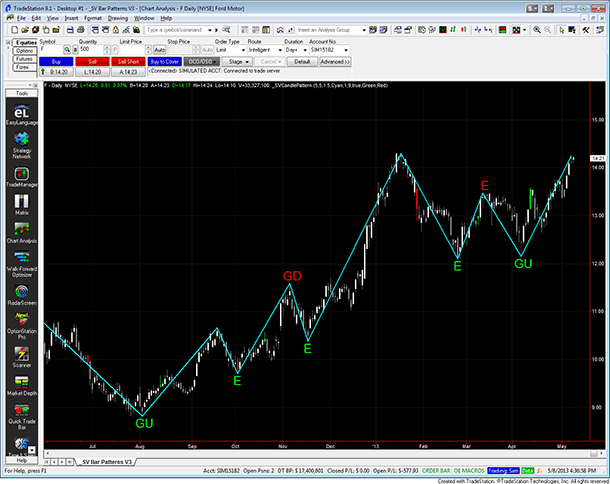
FIGURE 1: TRADESTATION. Shown here is a daily chart of Ford (F) with an indicator based on Sylvain Vervoort’s article applied to the chart. The indicator input settings can be seen in the status line at the top of the chart just to the right of the symbol and bar interval.
This article is for informational purposes. No type of trading or investment recommendation, advice, or strategy is being made, given, or in any manner provided by TradeStation Securities or its affiliates.
—Doug McCrary
TradeStation Securities, Inc.
www.TradeStation.com
BACK TO LIST

eSIGNAL: JULY 2013 TRADERS’ TIPS CODE
For this month’s Traders’ Tip, we’ve provided the formula SVEHLZZCandlePattern.efs based on the formula code from Sylvain Vervoort’s article in this issue, “The Step Candle Pattern.”
The study contains formula parameters to set the values for the zigzag percent, ATR lookback period, zigzag ATR factor, zigzag line color, line width, and candle pattern, which may be configured through the Edit Chart window (right-click on “Chart” and select “Edit chart”).
To discuss this study or download a complete copy of the eSignal formula code, please visit the EFS Library Discussion Board forum under the Forums link from the support menu at www.esignal.com or visit our EFS KnowledgeBase at https://www.esignal.com/support/kb/efs/. The eSignal formula scripts (EFS) are also available for copying and pasting below.
/*********************************

Provided By:

    Interactive Data Corporation (Copyright © 2013)

    All rights reserved. This sample eSignal Formula Script (EFS)

    is for educational purposes only. Interactive Data Corporation

    reserves the right to modify and overwrite this EFS file with

    each new release.


Description:

    The Step Candle Pattern, by Sylvain Vervoort


Version:            1.00  05/07/2013


Formula Parameters:                     Default:

ZigZag percent                          5

ATR Look back Period                    5

ZigZag ATR factor                       1.5

Color of ZigZag lines                   blue

Lines Width                             1

Candle Pattern                          Up/Down patterns


Notes:

    The related article is copyrighted material. If you are not a subscriber

    of Stocks & Commodities, please visit www.traders.com.


**********************************/


var pArray = new Array();


function preMain()

{


    setStudyTitle("Candle Pattern Indicator");

    setComputeOnClose();

    setPriceStudy(true);


    var x = 0;


    pArray[x] = new FunctionParameter("fpZigZagPercentage", FunctionParameter.NUMBER);

    with(pArray[x++])

    {

      setName("ZigZag percent");

      setLowerLimit(0);

      setDefault(5);

    }


    pArray[x] = new FunctionParameter("fpATRPeriod", FunctionParameter.NUMBER);

    with(pArray[x++])

    {

      setName("ATR Look back Period");

      setLowerLimit(1);

      setDefault(5);

    }


    pArray[x] = new FunctionParameter("fpATRFactor", FunctionParameter.NUMBER);

    with(pArray[x++])

    {

      setName("ZigZag ATR factor");

      setLowerLimit(0);

      setDefault(1.5);

    }


    pArray[x] = new FunctionParameter("fpZigZagColor", FunctionParameter.COLOR);

    with(pArray[x++])

    {

      setName("Color of ZigZag lines");

      setDefault(Color.blue);

    }


    pArray[x] = new FunctionParameter("fpLineWidth", FunctionParameter.NUMBER);

    with(pArray[x++])

    {

      setName("Lines Width");

      setLowerLimit(1);

      setDefault(1);

    }


    pArray[x] = new FunctionParameter("fpCandlePattern", FunctionParameter.STRING);

    with(pArray[x++])

    {

        setName("Candle Pattern");
        addOption("None");
        addOption("Up/Down patterns");
        addOption("Bullish/Bearish engulfing patterns");
        addOption("Bullish/Bearish harami (cross) patterns");

        addOption("All");
        setDefault("Up/Down patterns");

    }

}


var nTrend = 0;


var nLHb = 0;

var nLLb = 0;


var nHH = 0;

var bLL = 0;


var nDownlineID = 0;

var nUplineID = 0;


var nHLPivot = 0;


var xATR = null;

var xOpen = null;

var xClose = null;

var xHigh = null;

var xLow = null;


var bInit = false;

var bVersion = null;


var nBarNumber = 0;

var nPatternCnt = 0;


function main(

    fpZigZagPercentage,

    fpATRPeriod,

    fpATRFactor,

    fpZigZagColor,

    fpLineWidth,

    fpCandlePattern

)

{

    if (bVersion == null) bVersion = verify();

    if (bVersion == false) return;


    if(!bInit)

    {

        xATR = atr(fpATRPeriod);

        xOpen = open();

        xClose = close();

        xHigh = high();

        xLow = low();


        bInit = true;

    }

    if (getBarState()==BARSTATE_ALLBARS)

        nPatternCnt=0;


    nBarNumber = getCurrentBarCount();


    if(nBarNumber < 2)

    {

        bLL = xLow.getValue(0);

        nHH = xHigh.getValue(0);

        nLLb = nLHb = 1;

        nUplineID = nDownlineID = nBarNumber;

        nTrend = 1;

        return;

    }


    var nATR = xATR.getValue(0);


    if (nATR == null)

        return;


    if(fpATRFactor == 0)

    {

        nHLPivot = fpZigZagPercentage * 0.01;

    }

    else

    {

        if (fpZigZagPercentage == 0)

        {

            nHLPivot = nATR / xClose.getValue(0) * fpATRFactor;

        }

        else

        {

            nHLPivot = fpZigZagPercentage * 0.01 + nATR / xClose.getValue(0) * fpATRFactor;

        }

    }


    if (nTrend > 0)

    {

        if (xHigh.getValue(0) >= nHH)

        {

            nHH = xHigh.getValue(0);

            nLHb = nBarNumber;


            drawLineRelative(-(nBarNumber - nLLb), bLL, 0, nHH, PS_SOLID, fpLineWidth, fpZigZagColor, nUplineID);

        }

        else if (xLow.getValue(0) < nHH - nHH * nHLPivot)

        {

            bLL = xLow.getValue(0);

            nLLb = nBarNumber;

            nDownlineID = nBarNumber;

            nTrend = -1;


            drawLineRelative(-(nBarNumber - nLHb), nHH, 0, bLL, PS_SOLID, fpLineWidth, fpZigZagColor, nDownlineID);


            if (fpCandlePattern!="None")

            {

                if (fpCandlePattern=="Up/Down patterns" || fpCandlePattern=="All")

                {

                   var nStepDown =  StepDown();


                   if (nStepDown==0) nStepDown = BodyGapDown();

                   if (nStepDown==1)

                   {

                      drawTextRelative(-(nBarNumber - nLHb),AboveBar1,"D",Color.red,null,Text.BOLD | Text.PRESET | Text.CENTER, null, 12);

                      nPatternCnt++;

                      removeText("PatternCount");

                      drawTextPixel( 1, 13, nPatternCnt, fpZigZagColor, null, Text.RELATIVETOLEFT | Text.RELATIVETOBOTTOM | Text.BOLD, null, 12, "PatternCount" );

                      return;

                   }

                }


                if (fpCandlePattern=="Bullish/Bearish engulfing patterns" || fpCandlePattern=="All")

                   var nBearishEngulfing = BearishEngulfing();

                    if (nBearishEngulfing==1)

                    {

                      drawTextRelative(-(nBarNumber - nLHb),AboveBar1,"E",Color.red,null,Text.BOLD | Text.PRESET | Text.CENTER, null, 12);

                      nPatternCnt++;

                      removeText("PatternCount");

                      drawTextPixel( 1, 13, nPatternCnt, fpZigZagColor, null, Text.RELATIVETOLEFT | Text.RELATIVETOBOTTOM | Text.BOLD, null, 12, "PatternCount" );

                      return;

                    }


                if (fpCandlePattern=="Bullish/Bearish harami (cross) patterns" || fpCandlePattern=="All")

                    var nBearishHaram = BearishHarami();


                    if (nBearishHaram==1)

                    {

                      drawTextRelative(-(nBarNumber - nLHb),AboveBar1,"H",Color.red,null,Text.BOLD | Text.PRESET | Text.CENTER, null, 12);

                      nPatternCnt++;

                      removeText("PatternCount");

                      drawTextPixel( 1, 13, nPatternCnt, fpZigZagColor, null, Text.RELATIVETOLEFT | Text.RELATIVETOBOTTOM | Text.BOLD, null, 12, "PatternCount" );

                        return;

                    }

            }

        }

    }

    else

    {

        if (xLow.getValue(0) <= bLL)

        {

            bLL = xLow.getValue(0);

            nLLb = nBarNumber;


            drawLineRelative(-(nBarNumber - nLHb), nHH, 0, bLL, PS_SOLID, fpLineWidth, fpZigZagColor, nDownlineID);

        }

        else if (xHigh.getValue(0) > bLL + bLL * nHLPivot)

        {

            nHH = xHigh.getValue(0);

            nLHb = nBarNumber;

            nUplineID = nBarNumber;

            nTrend = 1;


            drawLineRelative(-(nBarNumber - nLLb), bLL, 0, nHH, PS_SOLID, fpLineWidth, fpZigZagColor, nUplineID);


            if (fpCandlePattern!="None")

            {

                if (fpCandlePattern=="Up/Down patterns" || fpCandlePattern=="All")

                {

                   var nStepUp =  StepUp();


                   if (nStepUp==0) nStepUp = BodyGapUp();

                   if (nStepUp==1)

                   {

                      drawTextRelative(-(nBarNumber - nLLb),BelowBar1,"U",Color.blue,null,Text.BOLD | Text.PRESET | Text.CENTER, null, 12);

                      nPatternCnt++;

                      removeText("PatternCount");

                      drawTextPixel( 1, 13, nPatternCnt, fpZigZagColor, null, Text.RELATIVETOLEFT | Text.RELATIVETOBOTTOM | Text.BOLD, null, 12, "PatternCount" );

                       return;

                   }

                }


                if (fpCandlePattern=="Bullish/Bearish engulfing patterns" || fpCandlePattern=="All")

                   var nBullishEngulfing = BullishEngulfing();

                    if (nBullishEngulfing==1)

                    {

                      drawTextRelative(-(nBarNumber - nLLb),BelowBar1,"E",Color.blue,null,Text.BOLD | Text.PRESET | Text.CENTER, null, 12);

                      nPatternCnt++;

                      removeText("PatternCount");

                      drawTextPixel( 1, 13, nPatternCnt, fpZigZagColor, null, Text.RELATIVETOLEFT | Text.RELATIVETOBOTTOM | Text.BOLD, null, 12, "PatternCount" );

                        return;

                    }


                if (fpCandlePattern=="Bullish/Bearish harami (cross) patterns" || fpCandlePattern=="All")

                    var nBullishHaram = BullishHarami();


                    if (nBullishHaram==1)

                    {

                      drawTextRelative(-(nBarNumber - nLLb),BelowBar1,"H",Color.blue,null,Text.BOLD | Text.PRESET | Text.CENTER, null, 12);

                      nPatternCnt++;

                      removeText("PatternCount");

                      drawTextPixel( 1, 13, nPatternCnt, fpZigZagColor, null, Text.RELATIVETOLEFT | Text.RELATIVETOBOTTOM | Text.BOLD, null, 12, "PatternCount" );

                        return;

                    }

            }


        }

    }

}


function verify()

{

    var b = false;

    if (getBuildNumber() < 779)

    {

        drawTextAbsolute(5, 35, "This study requires version 8.0 or later.",

            Color.white, Color.blue, Text.RELATIVETOBOTTOM|Text.RELATIVETOLEFT|Text.BOLD|Text.LEFT,

            null, 13, "error");

        drawTextAbsolute(5, 20, "Click HERE to upgrade.@URL=https://www.esignal.com/download/default.asp",

            Color.white, Color.blue, Text.RELATIVETOBOTTOM|Text.RELATIVETOLEFT|Text.BOLD|Text.LEFT,

            null, 13, "upgrade");

        return b;

    }

    else

    {

        b = true;

    }


    return b;

}


function StepUp()

{

    var nOpen0 = xOpen.getValue(-(nBarNumber-nLLb));

    var nOpen1 = xOpen.getValue(-(nBarNumber-nLLb+1));

    var nOpen_1 = xOpen.getValue(-(nBarNumber-nLLb-1));


    var nClose0 = xClose.getValue(-(nBarNumber-nLLb));

    var nClose1 = xClose.getValue(-(nBarNumber-nLLb+1));

    var nClose_1 = xClose.getValue(-(nBarNumber-nLLb-1));


    // Black body before last low bar and a step up white body at last low bar
    if (
    (nClose1 < nOpen1 &&
    nClose0 > nOpen0 &&
    nOpen0 >= nClose1 &&
    nOpen0 <= nOpen1 &&
    nClose0 > nOpen1) ||
    // Black body at the last low bar and step up white body after last low bar
    (nClose0 < nOpen0 &&
    nClose_1 > nOpen_1 &&
    nOpen_1 >= nClose0 &&
    nOpen_1 <= nOpen0 &&
    nClose_1 > nOpen0) ||
    // White body before last low bar and step up white body at last low bar
    (nClose1 > nOpen1 &&
    nClose0 > nOpen0 &&
    nOpen0 >= nOpen1 &&
    nOpen0 <= nClose1 &&
    nClose0 > nClose1) ||
    // White body at last low bar and a step up white body after last low bar
    (nClose0 > nOpen0 &&
    nClose_1 > nOpen_1 &&
    nOpen_1 >= nOpen0 &&
    nOpen_1 <= nClose0 &&
    nClose_1 > nClose0)
    ) return 1;
    else return 0;

}


function StepDown()

{

    var nOpen0 = xOpen.getValue(-(nBarNumber-nLHb));

    var nOpen1 = xOpen.getValue(-(nBarNumber-nLHb+1));

    var nOpen_1 = xOpen.getValue(-(nBarNumber-nLHb-1));


    var nClose0 = xClose.getValue(-(nBarNumber-nLHb));

    var nClose1 = xClose.getValue(-(nBarNumber-nLHb+1));

    var nClose_1 = xClose.getValue(-(nBarNumber-nLHb-1));


    // Black body before last high bar and a step down black body at last high bar
    if (
    (nClose1 < nOpen1 &&
    nClose0 < nOpen0 &&
    nOpen0 <= nOpen1 &&
    nOpen0 >= nClose1 &&
    nClose0 < nClose1) ||
    // Black body at the last high bar and step down black body after last high bar
    (nClose0 < nOpen0 &&
    nClose_1 < nOpen_1 &&
    nOpen_1 <= nOpen0 &&
    nOpen_1 >= nClose0 &&
    nClose_1 < nClose0) ||
    // White body before last high bar and a step down black body at last high bar
    (nClose1 > nOpen1 &&
    nClose0 < nOpen0 &&
    nOpen0 <= nClose1 &&
    nOpen0 >= nOpen1 &&
    nClose0 < nOpen1) ||
    // White body at last high bar and a step down black body after last high bar
    (nClose0 > nOpen0 &&
    nClose_1 < nOpen_1 &&
    nOpen_1 <= nClose0 &&
    nOpen_1 >= nOpen0 &&
    nClose_1 < nOpen0)
    ) return 1;
    else return 0;

}


function BodyGapUp()

{

    var nOpen0 = xOpen.getValue(-(nBarNumber-nLLb));

    var nOpen_1 = xOpen.getValue(-(nBarNumber-nLLb-1));


    var nClose0 = xClose.getValue(-(nBarNumber-nLLb));

    var nClose_1 = xClose.getValue(-(nBarNumber-nLLb-1));


    // Black body at the last low bar followed by a bar with a gap up or equal value
    if(
    (nClose0<= nOpen0 &&
    nOpen_1 >= nOpen0 &&
    nClose_1 >= nOpen0) ||
    // White body at last low bar followed by a bar with a gap up or equal value
    (nClose0 >= nOpen0 &&
    nOpen_1 >= nClose0 &&
    nClose_1 >= nClose0)
    ) return 1;
    else return 0;

}


function BodyGapDown()

{

    var nOpen0 = xOpen.getValue(-(nBarNumber-nLHb));

    var nOpen_1 = xOpen.getValue(-(nBarNumber-nLHb-1));


    var nClose0 = xClose.getValue(-(nBarNumber-nLHb));

    var nClose_1 = xClose.getValue(-(nBarNumber-nLHb-1));


    // White body at last high bar followed by a bar with a gap down or equal value
    if (
    (nClose0>=nOpen0 &&
    nOpen_1<= nOpen0 &&
    nClose_1<=nOpen0) ||
    // Black body at last high bar followed by a bar with a gap down or equal value
    (nClose0<=nOpen0 &&
    nOpen_1<= nClose0 &&
    nClose_1 <= nClose0)
    ) return 1;
    else return 0;

}


function BullishEngulfing()

{

    var nOpen0 = xOpen.getValue(-(nBarNumber-nLLb));

    var nOpen1 = xOpen.getValue(-(nBarNumber-nLLb+1));

    var nOpen_1 = xOpen.getValue(-(nBarNumber-nLLb-1));


    var nClose0 = xClose.getValue(-(nBarNumber-nLLb));

    var nClose1 = xClose.getValue(-(nBarNumber-nLLb+1));

    var nClose_1 = xClose.getValue(-(nBarNumber-nLLb-1));


    // Black small body or doji before last low bar and larger white at last low bar
    if (
    (nClose1 <= nOpen1 &&
    nClose0 > nOpen0 &&
    nOpen0<=nClose1 &&
    nClose0>= nOpen1) ||
    // Black small body or doji at the last low bar and larger white after last low bar
    (nClose0<= nOpen0 &&
    nClose_1> nOpen_1 &&
    nOpen_1<= nClose0 &&
    nClose_1>= nOpen0) ||
    // White small body or doji before last low bar and larger white at last low bar
    (nClose1>= nOpen1 &&
    nClose0 > nOpen0 &&
    nOpen0 <= nOpen1 &&
    nClose0>=nClose1) ||
    // White small body or doji at last low bar and larger white after last low bar
    (nClose0 >= nOpen0 &&
    nClose_1>nOpen_1 &&
    nOpen_1<=nOpen0 &&
    nClose_1>=nClose0)
    ) return 1;
    else return 0;

}


function BearishEngulfing()

{

    var nOpen0 = xOpen.getValue(-(nBarNumber-nLHb));

    var nOpen1 = xOpen.getValue(-(nBarNumber-nLHb+1));

    var nOpen_1 = xOpen.getValue(-(nBarNumber-nLHb-1));


    var nClose0 = xClose.getValue(-(nBarNumber-nLHb));

    var nClose1 = xClose.getValue(-(nBarNumber-nLHb+1));

    var nClose_1 = xClose.getValue(-(nBarNumber-nLHb-1));


    // White small body or doji before last high bar and larger black body at last high

    if (
    (nClose1 >= nOpen1 &&
    nClose0 < nOpen0 &&
    nOpen0 >= nClose1 &&
    nClose0 <= nOpen1) ||
    // White small body or doji at last high bar and larger black body after last high bar
    (nClose0 >= nOpen0 &&
    nClose_1 < nOpen_1 &&
    nOpen_1 >= nClose0 &&
    nClose_1 <= nOpen0) ||
    // Black small body or doji before last high bar and larger Black body at last high bar
    nClose1 <= nOpen1 &&
    nClose0 < nOpen0 &&
    nOpen0 >= nOpen1 &&
    nClose0 <= nClose1 ||
    // Black small body or doji at last high bar and larger Black body after last high bar
    nClose0 <= nOpen0 &&
    nClose_1 < nOpen_1 &&
    nOpen_1 >= nOpen0 &&
    nClose_1 <= nClose0
    ) return 1;
    else return 0;

}


function BearishHarami()

{

    var nOpen0 = xOpen.getValue(-(nBarNumber-nLHb));

    var nOpen1 = xOpen.getValue(-(nBarNumber-nLHb+1));

    var nOpen_1 = xOpen.getValue(-(nBarNumber-nLHb-1));


    var nClose0 = xClose.getValue(-(nBarNumber-nLHb));

    var nClose1 = xClose.getValue(-(nBarNumber-nLHb+1));

    var nClose_1 = xClose.getValue(-(nBarNumber-nLHb-1));


    // Black body at the last high bar and small white OR black body after last high bar
    if (
    (nClose0 < nOpen0 &&
    nOpen_1 >= nClose0 &&
    nOpen_1 <= nOpen0 &&
    nClose_1 >= nClose0 &&
    nClose_1 <= nOpen0) ||
    // White body at the last high bar and small white OR black body after last high bar
    (nClose0 > nOpen0 &&
    nOpen_1 <= nClose0 &&
    nOpen_1 >= nOpen0 &&
    nClose_1 <= nClose0 &&
    nClose_1 >= nOpen0) ||
    // Black body before the last high bar and small white OR black body at last high bar
    (nClose1 < nOpen1 &&
    nOpen0 >= nClose1 &&
    nOpen0 <= nOpen1 &&
    nClose0 >= nClose1 &&
    nClose0 <= nOpen1) ||
    // White body before the last high bar and small white OR black body at last high bar
    (nClose1 > nOpen1 &&
    nOpen0 <= nClose1 &&
    nOpen0 >= nOpen1 &&
    nClose0 <= nClose1 &&
    nClose0 >= nOpen1)
    ) return 1;
    else return 0;

}


function BullishHarami()

{

    var nOpen0 = xOpen.getValue(-(nBarNumber-nLLb));

    var nOpen1 = xOpen.getValue(-(nBarNumber-nLLb+1));

    var nOpen_1 = xOpen.getValue(-(nBarNumber-nLLb-1));


    var nClose0 = xClose.getValue(-(nBarNumber-nLLb));

    var nClose1 = xClose.getValue(-(nBarNumber-nLLb+1));

    var nClose_1 = xClose.getValue(-(nBarNumber-nLLb-1));


    // Black body at the last low bar and small white OR black body after last low bar
    if (
    (nClose0 < nOpen0 &&
    nOpen_1 >= nClose0 &&
    nOpen_1 <= nOpen0 &&
    nClose_1 >= nClose0 &&
    nClose_1 <= nOpen0) ||
    // White body at the last low bar and small white OR black body after last low bar
    (nClose0 > nOpen0 &&
    nOpen_1 <= nClose0 &&
    nOpen_1 >= nOpen0 &&
    nClose_1 <= nClose0 &&
    nClose_1 >= nOpen0) ||
    // Black body before the last low bar and small white OR black body at last low bar
    (nClose1 < nOpen1 &&
    nOpen0 >= nClose1 &&
    nOpen0 <= nOpen1 &&
    nClose0 >= nClose1 &&
    nClose0 <= nOpen1) ||
    // White body before the last low bar and small white OR black body at last low bar
    (nClose1 > nOpen1 &&
    nOpen0 <= nClose1 &&
    nOpen0 >= nOpen1 &&
    nClose0 <= nClose1 &&
    nClose0 >= nOpen1)
    ) return 1;
    else return 0;

}
A sample chart is shown in Figure 2.
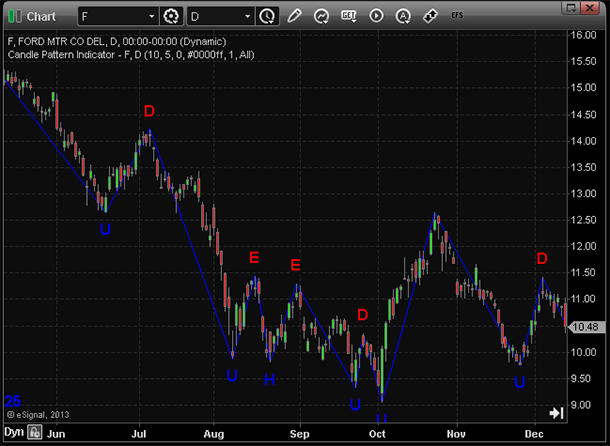
FIGURE 2: eSIGNAL. This study, based on Sylvain Vervoort’s article in this issue, contains formula parameters to set the values for the zigzag percent, ATR lookback period, zigzag ATR factor, zigzag line color, line width, and candle pattern.
—Jason Keck
eSignal, an Interactive Data company
800 779-6555, www.eSignal.com
BACK TO LIST

THINKORSWIM: JULY 2013 TRADERS’ TIPS CODE
In “The Step Candle Pattern” in this issue, author Sylvain Vervoort continues with part 3 of his ongoing article series on a swing trading strategy. This month, Vervoort focuses on using candlestick patterns to build pivot points.
For thinkorswim users, we have created a study in our proprietary scripting language, thinkScript. You can adjust the parameters of the study within the Edit Studies window to fine-tune the periods calculated.
A sample chart is shown in Figure 3.
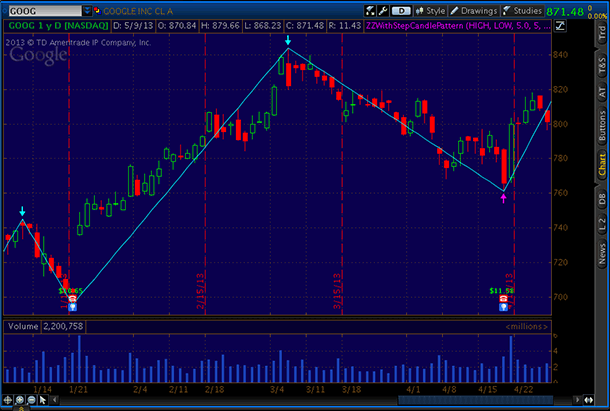
FIGURE 3: THINKORSWIM. Here is the advance-decline cumulative average study and strategy displayed on a thinkorswim chart.
The study:
- From TOS charts, select Studies → Edit Studies
- Select the Studies tab in the upper left-hand corner
- Select “New” in the lower left-hand corner
- There are three studies this month, separated by #s
- Name the study (such as “ZZWithStepCandlePattern”)
- Click in the script editor window, remove “plot data = close” and paste in the following code:
###################
input priceH = high;
input priceL = low;
input zzPercent = 5.0;
input atrLength = 5;
input atrFactor = 1.5;

Assert(zzPercent >= 0, "'zz percent' must not be negative: " + zzPercent);
Assert(atrFactor >= 0, "'atr factor' must not be negative: " + atrFactor);
Assert(zzPercent != 0 or atrFactor != 0, "Both 'zz percent' and 'atr factor' cannot be zero");

def hlPivot = if zzPercent != 0 then zzPercent / 100 else 0 + if atrFactor != 0 then ATRWilder(atrLength) / close * atrFactor else 0;
def state = {default init, undefined, uptrend, downtrend};
def maxPriceH;
def minPriceL;
def newMax;
def newMin;

if GetValue(state, 1) == GetValue(state.init, 0) {
    maxPriceH = priceH;
    minPriceL = priceL;
    newMax = yes;
    newMin = yes;
    state = state.undefined;
} else if GetValue(state, 1) == GetValue(state.undefined, 0) {
    if priceH >= GetValue(maxPriceH, 1) {
        state = state.uptrend;
        maxPriceH = priceH;
        minPriceL = GetValue(minPriceL, 1);
        newMax = yes;
        newMin = no;
    } else if priceL <= GetValue(minPriceL, 1) {
        state = state.downtrend;
        maxPriceH = GetValue(maxPriceH, 1);
        minPriceL = priceL;
        newMax = no;
        newMin = yes;
    } else {
        state = state.undefined;
        maxPriceH = GetValue(maxPriceH, 1);
        minPriceL = GetValue(minPriceL, 1);
        newMax = no;
        newMin = no;
    }
} else if GetValue(state, 1) == GetValue(state.uptrend, 0) {
    if priceL <= GetValue(maxPriceH, 1) - GetValue(maxPriceH, 1) * hlPivot {
        state = state.downtrend;
        maxPriceH = GetValue(maxPriceH, 1);
        minPriceL = priceL;
        newMax = no;
        newMin = yes;
    } else {
        state = state.uptrend;
        if (priceH >= GetValue(maxPriceH, 1)) {
            maxPriceH = priceH;
            newMax = yes;
        } else {
            maxPriceH = GetValue(maxPriceH, 1);
            newMax = no;
        }
        minPriceL = GetValue(minPriceL, 1);
        newMin = no;
    }
} else {
    if priceH >= GetValue(minPriceL, 1) + GetValue(minPriceL, 1) * hlPivot {
        state = state.uptrend;
        maxPriceH = priceH;
        minPriceL = GetValue(minPriceL, 1);
        newMax = yes;
        newMin = no;
    } else {
        state = state.downtrend;
        maxPriceH = GetValue(maxPriceH, 1);
        newMax = no;
        if (priceL <= GetValue(minPriceL, 1)) {
            minPriceL = priceL;
            newMin = yes;
        } else {
            minPriceL = GetValue(minPriceL, 1);
            newMin = no;
        }
    }
}

def barNumber = BarNumber();
def barCount = HighestAll(If(IsNaN(priceH), 0, barNumber));
def newState = GetValue(state, 0) != GetValue(state, 1);
def offset = barCount - barNumber + 1;

def lastH;
if state == state.uptrend and priceH == maxPriceH and offset > 1 {
    lastH = fold iH = 1 to offset with tH = priceH while !IsNaN(tH) and !GetValue(newState, -iH) do if GetValue(newMax, -iH) or iH == offset - 1  then Double.NaN else tH;
} else {
    lastH = Double.NaN;
}

def lastL;
if state == state.downtrend and priceL == minPriceL and offset > 1 {
    lastL = fold iL = 1 to offset with tL = priceL while !IsNaN(tL) and !GetValue(newState, -iL) do if GetValue(newMin, -iL) or iL == offset - 1 then Double.NaN else tL;
} else {
    lastL = Double.NaN;
}

plot ZZ;
if barNumber == 1 {
    ZZ = fold iF = 1 to offset with tP = Double.NaN while IsNaN(tP) do if GetValue(state, -iF) == GetValue(state.uptrend, 0) then priceL else if GetValue(state, -iF) == GetValue(state.downtrend, 0) then priceH else Double.NaN;
} else if barNumber == barCount {
    ZZ = if state == state.uptrend and priceH == maxPriceH then priceH else if state == state.downtrend and priceL == minPriceL then priceL else if state == state.uptrend and priceH < maxPriceH then priceL else if state == state.downtrend and priceL > minPriceL then priceH else Double.NaN;
} else {
    ZZ = if !IsNaN(lastH) then lastH else if !IsNaN(lastL) then lastL else Double.NaN;
}
ZZ.SetDefaultColor(GetColor(1));
ZZ.EnableApproximation();< AvgCumAD, name = "AdvanceDeclineCumAvgLX");
—thinkorswim
A division of TD Ameritrade, Inc.
www.thinkorswim.com
BACK TO LIST

WEALTH-LAB: JULY 2013 TRADERS’ TIPS CODE
Last month in the June 2013 Traders’ Tips, we presented a simplified version of Sylvain Vervoort’s zigzag indicator based on Vervoort’s article in that issue. That strategy was based on closing prices. This time, the focus is Vervoort’s article in this issue, “The Step Candle Pattern” (part 3 of a seven-part article series), in which he discusses swing detection using high and low prices so as to fully comply with his swing trading strategy.
Since no trading rules were given by Vervoort in this month’s article, the system in its current stage performs only the charting. The system marks each zigzag leg on the chart, connecting them with colored lines. The blue/red letters attached to turning points indicate downstep (D), upstep (U), engulfing (E), and harami (H) patterns, respectively.
To execute this successfully in Wealth-Lab, you will need the companion SVEHLZZperc indicator presented last month. To get the indicator, you can install or update the TASCIndicators library from www.wealth-lab.com, if you haven’t done so already, to the latest version, which is 2013.04 or higher.
A sample chart is shown in Figure 4.
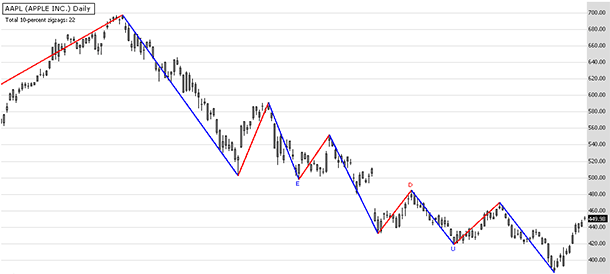
FIGURE 4: WEALTH-LAB. This sample Wealth-Lab 6 chart pinpoints engulfing, downstep, and upstep patterns that occurred at reversal points on a chart of Apple (AAPL).
C# Code

using System;
using System.Collections.Generic;
using System.Text;
using System.Drawing;
using WealthLab;
using WealthLab.Indicators;
using WealthLab.Rules.Candlesticks;
using TASCIndicators;

namespace WealthLab.Strategies
{
	public class IRSTS_StepPattern : WealthScript
	{
		private StrategyParameter paramPercent;
		private StrategyParameter paramLookbackForStepPattern;

		public IRSTS_StepPattern()
		{
			paramPercent = CreateParameter("Reversal %", 10.0, 1.0, 50.0, 1.0);
			paramLookbackForStepPattern = CreateParameter("Lookback", 3, 1, 20, 1);
		}

		bool isInsideBody( int bar, double price ) {
			return price <= Math.Max(Open[bar],Close[bar]) && price >= Math.Min(Open[bar],Close[bar]);
		}

		bool Upstep( int bar, int lookback ) {
			bool result = false;
			bool way1 = (Open[bar] > Close[bar] & Open[bar+1] < Close[bar+1]) && isInsideBody(bar, Open[bar+1]) && Close[bar+1] > Open[bar];
			bool way2 = (Open[bar] < Close[bar] & Open[bar+1] < Close[bar+1]) && isInsideBody(bar, Open[bar+1]) && Close[bar+1] > Close[bar];
			bool way3 = (Open[bar-1] > Close[bar-1]) && (Open[bar] < Close[bar]) && isInsideBody(bar, Open[bar+1]) && (Close[bar] > Open[bar-1]);
			bool way4 = (Open[bar-1] < Close[bar-1]) && (Open[bar] < Close[bar]) && isInsideBody(bar, Open[bar+1]) && (Close[bar] > Close[bar-1]);
			result = bar == LowestBar.Series( Low,lookback )[bar] && ( way1 | way2 | way3 | way4 );
			return result;
		}

		bool Downstep( int bar, int lookback ) {
			bool result = false;
			bool way1 = (Open[bar] < Close[bar] & Open[bar+1] > Close[bar+1]) && isInsideBody(bar, Open[bar+1]) && Close[bar+1] < Open[bar];
			bool way2 = (Open[bar] > Close[bar] & Open[bar+1] > Close[bar+1]) && isInsideBody(bar, Open[bar+1]) && Close[bar+1] < Close[bar];
			bool way3 = (Open[bar-1] < Close[bar-1]) && (Open[bar] > Close[bar]) && isInsideBody(bar, Open[bar+1]) && (Close[bar] < Open[bar-1]);
			bool way4 = (Open[bar-1] > Close[bar-1]) && (Open[bar] > Close[bar]) && isInsideBody(bar, Open[bar+1]) && (Close[bar] < Close[bar-1]);
			result = bar == HighestBar.Series( High,lookback )[bar] && ( way1 | way2 | way3 | way4 );
			return result;
		}

		protected override void Execute()
		{
			int lookback = paramLookbackForStepPattern.ValueInt;
			double percent = paramPercent.Value;
			const string t = "\t"; string s = string.Empty;
			ZZBuilder zz = new ZZBuilder( Bars, percent );
			List<ZigZag> lst = zz.ZigZags;

			bool[] BearishEngulfing; CandlePattern.BearishEngulfingLines(this, s, false, out BearishEngulfing);
			bool[] BullishEngulfing; CandlePattern.BullishEngulfingLines(this, s, false, out BullishEngulfing);
			bool[] BearishHarami; CandlePattern.BearishHarami(this, s, false, out BearishHarami);
			bool[] BullishHarami; CandlePattern.BullishHarami(this, s, false, out BullishHarami);
			HideVolume(); SetBarColors(Color.Silver,Color.Silver);

			if( lst != null )
			{
				DrawLabel(PricePane, string.Format( "Total {0}-percent zigzags: {1}", percent, lst.Count) );
				foreach( ZigZag z in lst ) {
					DrawLine( PricePane, z.zigBar, z.inPrice, z.zagBar, z.outPrice,
						z.isMoveUp ? Color.Blue : Color.Red, LineStyle.Solid, 2 );
				}
			}

			for(int bar = 2 + lookback; bar < Bars.Count; bar++)
			{
				if( lst != null ) {
					if( lst.Count > 0 ) {
						int idx = 0;
						foreach( ZigZag z in lst ) {
							if( z.barDetected == bar ) {
								//SetBackgroundColor( bar, !z.isMoveUp ? Color.FromArgb(30,Color.Green) : Color.FromArgb(30,Color.Red) );

								if( Downstep( z.zagBar, lookback ) )
									AnnotateBar( "D", z.zagBar, true, Color.Red );
								if (BearishHarami[z.zagBar])
									AnnotateBar( "H", z.zagBar, true, Color.Red );
								if (BearishEngulfing[z.zagBar])
									AnnotateBar( "E", z.zagBar, true, Color.Red );

								if( Upstep( z.zagBar, lookback ) )
									AnnotateBar( "U", z.zagBar, false, Color.Blue );
								if (BullishHarami[z.zagBar])
									AnnotateBar( "H", z.zagBar, false, Color.Blue );
								if (BullishEngulfing[z.zagBar])
									AnnotateBar( "E", z.zagBar, false, Color.Blue );
							}
						}
					}
				}
			}
		}
	}

	public class XEvent
	{
		public int Bar {get; set; }
		public int Type {get; set; }
		public double Price {get; set; }

		public XEvent( int bar, int type ) { Bar = bar; Type = type; }
		public XEvent( int bar, int type, double price ) { Bar = bar; Type = type; Price = price; }
	}

	public enum Wave {W1, W2, W3}

	public class ZigZag
	{
		public int barDetected { get; set; }
		public bool isMoveUp { get; set; }
		public int zigBar { get; set; }
		public int zagBar { get; set; }
		public double inPrice { get; set; }
		public double outPrice { get; set; }
		public double magnitude { get; set; }

		public Wave wave { get; set; }
		public int leg3Count { get; set; }

		public ZigZag(int barDetected, bool isMoveUp, int zigBar, int zagBar, double inPrice, double outPrice, double magnitude)
		{
			this.barDetected = barDetected;
			this.isMoveUp = isMoveUp;
			this.zigBar = zigBar;
			this.zagBar = zagBar;
			this.inPrice = inPrice;
			this.outPrice = outPrice;
			this.magnitude = magnitude;
			this.leg3Count = 0;
		}
	}

	public class ZZBuilder
	{
		private bool Initialized = false;
		public Bars bars { get; private set; }
		public double percent { get; private set; }
		public List<ZigZag> ZigZags { get; private set; }

		public ZZBuilder( Bars b, double pct )
		{
			this.bars = b;
			this.percent = pct;

			BuildZZHiLo();
			//BuildZZ();
		}

		private void BuildZZHiLo()
		{
			try {
				DataSeries zz = SVEHLZZperc.Series(bars,percent,14,3,SVEHLZZperc_Type.Percent);
				List<XEvent> lstX = new List<XEvent>();
				lstX.Add( new XEvent( 0, 0 ) );

				for(int bar = 1; bar < bars.Count; bar++)
				{
					if( bars.High[bar - 1] < zz[bar - 1] && bars.High[bar] > zz[bar] ) {
						lstX.Add( new XEvent(bar, 1) );
					}

					if( bars.Low[bar - 1] > zz[bar - 1] && bars.Low[bar] < zz[bar] ) {
						lstX.Add( new XEvent(bar, -1) );
					}
				}

				for(int bar = 0; bar < bars.Count; bar++)
				{
					for( int i = 0; i < lstX.Count; i++ ) {
						if( i == 0 ) continue;
						XEvent e = lstX[i];
						if( e.Bar == bar ) {
							int prevEventBar = lstX[i - 1].Bar;
							int step = bar-prevEventBar;
							if( e.Type == 1 ) {
								double Trough = Lowest.Value( bar, bars.Low, step );
								e.Price = Trough;
								e.Bar = (int)LowestBar.Value( bar, bars.Low, step );
							}
							else if( e.Type == -1 ) {
								double Peak = Highest.Value( bar, bars.High, step );
								e.Price = Peak;
								e.Bar = (int)HighestBar.Value( bar, bars.High, step );
							}

							break;
						}
					}
				}

				List<ZigZag> lst = new List<ZigZag>();
				double inPrice = 0, outPrice = 0, magnitude = 0;
				int barDetected = 0, zigBar = 0, zagBar = 0;
				bool detected = false;

				for(int bar = 1; bar < bars.Count; bar++)
				{
					detected = false;
					XEvent e = lstX[0];
					XEvent prev = lstX[0];

					for( int i = 0; i < lstX.Count; i++ ) {
						if( i == 0 ) continue;
						e = lstX[i];
						prev = lstX[i - 1];
						if( e.Bar == bar ) {
							detected = true; break;
						}
					}

					if( detected ) {

						bool isMoveUp = (e.Type == 1);
						if( isMoveUp ) {
							zigBar = prev.Bar; zagBar = e.Bar; inPrice = prev.Price; outPrice = e.Price;
						}
						else {
							zigBar = prev.Bar; zagBar = e.Bar; inPrice = prev.Price; outPrice = e.Price;
						}
						magnitude = Math.Abs( inPrice - outPrice );

						lst.Add( new ZigZag( bar, isMoveUp, zigBar, zagBar, inPrice, outPrice, magnitude ) );
					}
				}

				ZigZags = lst;
				Initialized = true;
			}
			catch {
			}
		}

		[Obsolete]
		private void BuildZZ()
		{
			try
			{
				PeakTroughMode mode = WealthLab.Indicators.PeakTroughMode.Percent;
				PeakBar pb = PeakBar.Series(bars.Close,percent,mode);
				TroughBar tb = TroughBar.Series(bars.Close,percent,mode);
				Trough tr = Trough.Series(bars.Close,percent,mode);
				Peak pk = Peak.Series(bars.Close,percent,mode);
				List<ZigZag> lst = new List<ZigZag>();
				double t1 = 0, p1 = 0, inPrice, outPrice = 0, magnitude = 0;
				int tb1 = 0, pb1, barDetected = 0, zigBar = 0, zagBar = 0;
				bool detected = false;

				for(int bar = 1; bar < bars.Count; bar++)
				{
					detected = false;

					t1 = tr[bar];
					tb1 = (int)tb[bar];
					if (tb1 == -1) continue;

					p1 = pk[bar];
					pb1 = (int)pb[bar];
					if (pb1 == -1) continue;

					if( tb[bar] > tb[bar-1] && pb[bar] > -1){
						detected = true;
					}

					if( pb[bar] > pb[bar-1] && tb[bar] > -1 ){
						detected = true;
					}

					if( detected ) {

						bool isMoveUp = (tb1 < pb1);
						magnitude = Math.Abs( bars.High[pb1] - bars.Low[tb1] );

						if( isMoveUp ) {
							zigBar = tb1; zagBar = pb1; inPrice = t1; outPrice = p1;
						}
						else {
							zigBar = pb1; zagBar = tb1; inPrice = p1; outPrice = t1;
						}

						lst.Add( new ZigZag( bar, isMoveUp, zigBar, zagBar, inPrice, outPrice, magnitude ) );
					}
				}

				ZigZags = lst;
				Initialized = true;
			}
			catch {
			}
		}
	}
}
—Eugene & Wealth-Lab team
MS123, LLC
www.wealth-lab.com
BACK TO LIST

AMIBROKER: JULY 2013 TRADERS’ TIPS CODE
In “The Step Candle Pattern” in this issue, author Sylvain Vervoort presents a method of identifying candlestick patterns that appear at turning points. The code builds on his formula presented last month in his June 2013 article (“The 1-2-3 Wave Count”) by adding candlestick pattern identification rules.
We have created a ready-to-use AmiBroker formula for the indicator, the code for which is shown below, as well as being available from our website, www.amibroker.com. To display the indicator on an AmiBroker chart, simply input the code into the formula editor and press “Apply indicator.” You can choose which patterns to display as well as adjust the ZZPercent, ATRPeriod, and ATRFactor parameters by right-clicking the chart and selecting “parameters” from the context menu.
LISTING 1.
nc = Ref( Close, 1 ); // next close
pc = Ref( Close, -1 ); // previous close
no = Ref( Open, 1 ); // next open
po = Ref( Open, -1 ); // previous open

StepUp =
// Black body before last low bar
// and a step up white body at last low bar
( pC < pO AND
  Close > Open AND
  Open >= pC AND
  Open <= pO AND
  Close > pO OR
// Black body at the last low bar
// and step up white body after last low bar
  Close < Open AND
  nC > nO AND
  nO >= Close AND
  nO <= Open AND
  nC > Open OR
// White body before last low bar
// and step up white body at last low bar
  pC > pO AND
  Close > Open AND
  Open >= pO AND
  Open <= pC AND
  Close > pC OR
// White body at last low bar
// and a step up white body after last low bar
  Close > Open AND
  nC > po AND
  nO >= Open AND
  nO <= Close AND
  nC > Close );

StepDown =
// Black body before last high bar
// and a step down black body at last high bar
( pC < pO AND
  Close < Open AND
  Open <= pO AND
  Open >= pC AND
  Close < pC OR
// Black body at the last high bar
// and step down black body after last high bar
  Close < Open AND
  nC < nO AND
  nO <= Open AND
  nO >= Close AND
  nC < Close OR
// White body before last high bar
// and a step down black body at last high bar
  pC > pO AND
  Close < Open AND
  Open <= pC AND
  Open >= pO AND
  Close < pO OR
// White body at last high bar
// and a step down black body after last high bar
  Close > Open AND
  nC < nO AND
  nO <= Close AND
  nO >= Open AND
  nC < Open );

BodyGapUp =
// Black body at the last low bar
// followed by a bar with a gap up or equal value
( Close <= Open AND
  nO >= Open AND
  nC >= Open OR
// White body at last low bar
// followed by a bar with a gap up or equal value
  Close >= Open AND
  nO >= Close AND
  nC >= Close );

BodyGapDown =
// White body at last high bar
// followed by a bar with a gap down or equal value
( Close >= Open AND
  nO <= Open AND
  nC <= Open OR
// Black body at last high bar
// followed by a bar with a gap down or equal value
  Close <= Open AND
  nO <= Close AND
  nC <= Close );

BullishEngulfing =
// Black small body or doji before last low bar
// and larger white at last low bar
( pC <= pO AND
  Close > Open AND
  Open <= pC AND
  Close >= pO OR
// Black small body or doji at the last low bar
// and larger white after last low bar
  Close <= Open AND
  nC > nO AND
  nO <= Close AND
  nC >= Open OR
// White small body or doji before last low bar
// and larger white at last low bar
  pC >= pO AND
  Close > Open AND
  Open <= pO AND
  Close >= pC OR
// White small body or doji at last low bar
// and larger white after last low bar
  Close >= Open AND
  nC > O AND
  nO <= Open AND
  nC >= Close );

BearishEngulfing =
// White small body or doji before last high bar
// and larger black body at last high
( pC >= pO AND
  Close < Open AND
  Open >= pC AND
  Close <= pO OR
// White small body or doji at last high bar
// and larger black body after last high bar
  Close >= Open AND
  nC < nO AND
  nO >= Close AND
  nC <= Open OR
// Black small body or doji before last high bar
// and larger Black body at last high bar
  pC <= pO AND
  Close < Open AND
  Open >= pO AND
  Close <= pC OR
// Black small body or doji at last high bar
// and larger Black body after last high bar
  Close <= Open AND
  nC < nO AND
  nO >= Open AND
  nC <= Close );

BullishHarami =
// Black body at the last low bar and small white
// OR black body after last low bar
( Close < Open AND
  nO >= Close AND
  nO <= Open AND
  nC >= Close AND
  nC <= Open OR
// White body at the last low bar and small white
// OR black body after last low bar
  Close > Open AND
  nO <= Close AND
  nO >= Open AND
  nC <= Close AND
  nC >= Open OR
// Black body before the last low bar and small white
// OR black body at last low bar
  pC < no AND
  Open >= pC AND
  Open <= pO AND
  Close >= pC AND
  Close <= pO OR
// White body before the last low bar and small white
// OR black body at last low bar
  pC > pO AND
  Open <= pC AND
  Open >= pO AND
  Close <= pC AND
  Close >= pO );

BearishHarami =
// Black body at the last high bar and small white
// OR black body after last high bar
( Close < Open AND
  nO >= Close AND
  nO <= Open AND
  nC >= Close AND
  nC <= Open OR
// White body at the last high bar and small white
// OR black body after last high bar
  Close > Open AND
  nO <= Close AND
  nO >= Open AND
  nC <= Close AND
  nC >= Open OR
// Black body before the last high bar and small white
// OR black body at last high bar
  pC < pO AND
  Open >= pC AND
  Open <= pO AND
  Close >= pC AND
  Close <= pO OR
// White body before the last high bar and small white
// OR black body at last high bar
  pC > pO AND
  Open <= pC AND
  Open >= pO AND
  Close <= pC AND
  Close >= pO );

function DrawBearishPattern( CandlePattern, bar, y )
{
  Found = False;

  if( CandlePattern == "Step Up/Dn" OR CandlePattern == "All" )
  {
    if( StepDown[ bar ] OR BodyGapDown[ bar ] )
    {
      PlotText( "D", bar, y, colorRed );
      Found = True;
    }
  }

  if( NOT Found AND
     ( CandlePattern == "Engulfing" OR CandlePattern == "All" ) )
  {
    if( BearishEngulfing[ bar ] )
    {
      PlotText( "E", bar, y, colorRed );
      Found = True;
    }
  }

  if( NOT Found AND
     ( CandlePattern == "Harami" OR CandlePattern == "All" ) )
  {
    if( BearishHarami[ bar ] )
    {
      PlotText( "H", bar, y, colorRed );
      Found = True;
    }
  }

  return Found;
}

function DrawBullishPattern( CandlePattern, bar, y )
{
  Found = False;

  if( CandlePattern == "Step Up/Dn" OR CandlePattern == "All" )
  {
    if( StepUp[ bar ] OR BodyGapUp[ bar ] )
    {
      PlotText( "U", bar, y, colorBlue );
      Found = True;
    }
  }

  if( NOT Found AND
     ( CandlePattern == "Engulfing" OR CandlePattern == "All" ) )
  {
    if( BullishEngulfing[ bar ] )
    {
      PlotText( "E", bar, y, colorBlue );
      Found = True;
    }
  }

  if( NOT Found AND
     ( CandlePattern == "Harami" OR CandlePattern == "All" ) )
  {
    if( BullishHarami[ bar ] )
    {
      PlotText( "H", bar, y, colorBlue );
      Found = True;
    }
  }

  return Found;
}

CandlePattern = ParamList("CandlePattern",
                "None|Step Up/Dn|Engulfing|Harami|All", 4);
ZZPercent = Param("ZZPercent", 5 );
ATRPeriod = Param("ATRPeriod", 5 );
ATRFactor = Param("ATRFactor", 1.5, 0, 5 );

HLPivot = ZZPercent * 0.01 + ATRFactor * ATR( ATRPeriod )/Close;

Ll = Low[ 0 ];
Hh = High[ 0 ];
Llb = Lhb = 0;

if( High[ 1 ] >= Hh )
{
  Hh = High[ 1 ];
  Lhb = trend = 1;
}
else
{
  Ll = Low[ 1 ];
  Llb = 1;
  trend = -1;
}

Line = Null;

PattFound = 0;

for( i = 2; i < BarCount; i++ )
{
  if( trend > 0 )
  {
    if( High[ i ] >= Hh )
    {
      Hh = High[ i ];
      Lhb = i;
      Curline = LineArray( Llb, Ll, Lhb, Hh );
      Line = IIf( IsNull( CurLine ), Line, CurLine );
    }
    else
    if( Low[ i ] < Hh - Hh * HLPivot[ i ] )
    {
      Ll = Low[ i ];
      Llb = i;
      trend = -1;
      CurLine = LineArray( Lhb, Hh, Llb, Ll );
      Line = IIf( IsNull( CurLine ), Line, CurLine );

      PattFound += DrawBearishPattern( CandlePattern, Lhb, Hh + HH*0.01);
    }
  }
  else
  {
    if( Low[ i ] <= Ll )
    {
      Ll = Low[ i ];
      Llb = i;
      CurLine = LineArray( Lhb, Hh, Llb, Ll );
      Line = IIf( IsNull( CurLine ), Line, CurLine );
    }
    else
    if( High[ i ] > Ll + Ll * HLPivot[ i ] )
    {
      Hh = High[ i ];
      lhb = i;
      trend = 1;
      CurLine = LineArray( Llb, Ll, Lhb, Hh );
      Line = IIf( IsNull( CurLine ), Line, CurLine );

      PattFound += DrawBullishPattern( CandlePattern, LLb, LL - LL * 0.03);
    }
  }
}

Plot( Line, "", colorBlueGrey, styleThick );
Plot( Close, Date()+ " Close", colorDefault, styleCandle );
A sample chart is shown in Figure 5.
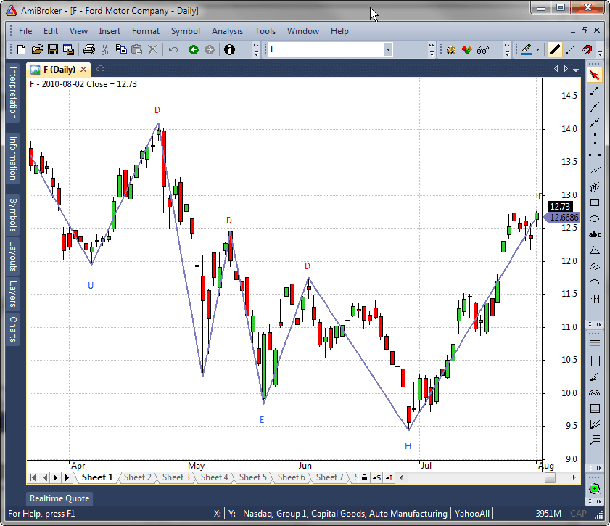
FIGURE 5: AMIBROKER. Here is a price chart of Ford (F) with a high-low zigzag overlay and detected upstep/downstep, engulfing, and harami patterns, replicating the results from Sylvain Vervoort’s article in this issue.
—Tomasz Janeczko, AmiBroker.com
www.amibroker.com
BACK TO LIST

NEUROSHELL TRADER: JULY 2013 TRADERS’ TIPS CODE
The SVEHLZZCandlePattern indicator described by Sylvain Vervoort in his article in this issue, “The Step Candle Pattern,” can be implemented in NeuroShell Trader using NeuroShell Trader’s ability to call external programs. The programs may be written in C, C++, Power Basic, or Delphi.
After coding an indicator in your preferred compiler and creating a dynamic link library (DLL), you can insert the resulting SVEHLZZCandlePattern indicator into NeuroShell Trader as follows:
- Select “New Indicator...” from the Insert menu
- Choose the External Program & Library Calls category
- Select the appropriate External DLL Call indicator
- Set up the parameters to match your DLL
- Select the Finished button.
An alternative method of analyzing wave counts in Neuro-Shell Trader is to use the Turning Points add-on, which not only plots lines between peaks & valleys, but also plots peak/valley support & resistance lines; the support/resistance price oscillator; Fibonacci retracement lines; price, time, and slope statistical measures; and the probability that the current price is a new peak or valley.
Users of NeuroShell Trader can go to the Stocks & Commodities section of the NeuroShell Trader free technical support website to download a copy of this or any previous Traders’ Tips. The implementation of the SVEHLZZCandlePattern indicator available on our website produces numeric pattern values that may be used in predictions or trading strategies, where 1 is an upstep pattern, 2 is a bullish engulfing pattern, 3 is a bullish harami pattern, -1 is a downstep pattern, -2 is a bearish engulfing pattern, and -3 is a bearish harami pattern.
A sample chart is shown in Figure 6.
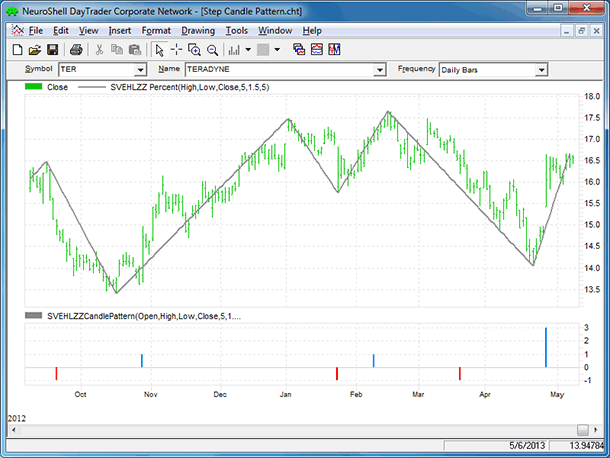
FIGURE 6: NEUROSHELL TRADER. This sample NeuroShell Trader chart shows the SVEHLZZCandlePattern indicator.
—Marge Sherald, Ward Systems Group, Inc.
301 662-7950, sales@wardsystems.com
www.neuroshell.com
BACK TO LIST

AIQ: JULY 2013 TRADERS’ TIPS CODE
For this month’s Traders’ Tip, I chose to provide AIQ code for an indicator discussed in the Bonus Issue 2013 S&C article by Martha Stokes, “Balancing Your Indicators.”
In the article, Stokes discusses several indicators but focuses on the price versus volume rate of change. She suggests that we look for divergences in price versus volume change. She does not give specific formulas or describe how the indicators should be constructed, nor how the divergence could be mechanized. She only shows examples of the indicators and gives interpretations on a given stock.
To code the indicators, I used linear regression (LR) of the price compared to linear regression of the volume. We need to take the rate of change of each in order to normalize so that we can compare and find the divergence. I get the LR rate of change of each indicator by using the endpoints of the LR line (endpoint divided by beginning point minus 1). I use the slope to be sure the sign is correct. In other words, if the linear regression slope is positive, then the rate of change must be positive. If it’s negative, then the rate of change must be negative.
Next, I take the standard deviation (STD) of the difference (DIFF) between the LR percent rate of change of volume minus the LR percent rate of change of price. By dividing the current DIFF by the STD, I get a measure of how much divergence is currently occurring. When the divergence exceeds the input value, buy & sell signals can be generated.
In Figure 7, I show a chart of Autodesk (ADSK) with the linear regression lines drawn in on the price and volume. We see that price has a negative rate of change, and volume has a positive rate of change. The divergence indicator exceeded the two–standard deviation positive level on July 9, 2009 for a buy signal. Holding for 10 trading days, the trade generated a profit of 23.69%.
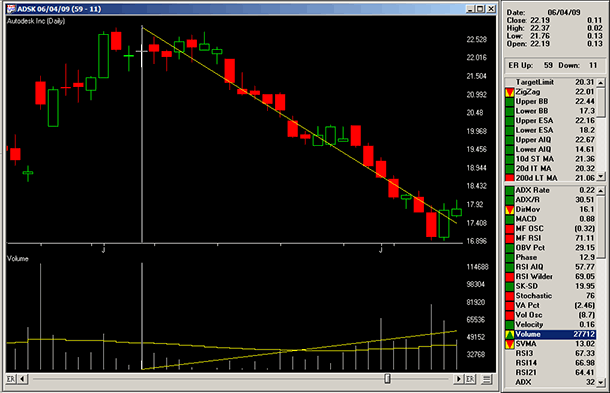
FIGURE 7: AIQ, VOLUME-PRICE DIVERGENCE INDICATOR. Here is a chart of Autodesk (ADSK) showing a positive divergence signal on 7/9/2009, with linear regression (LR) lines on price and volume.
In Figure 8, I show the divergence indicator on ADSK with the date shifted to the exit date. I picked this trade because it was a clear example of how well the indicator can work; however, there were many other trades that did not work as well as this one.
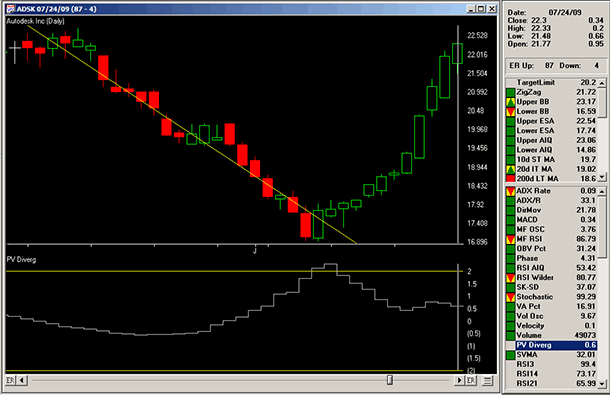
FIGURE 8: AIQ, TRADE EXIT. Here is a chart of ADSK on the date of the trade exit (7/24/2009) with the divergence indicator and the two–standard deviation signal lines. When the indicator crosses above the upper signal line on 7/9/2009, a buy signal is given. This trade was entered on 7/10/2009 at the open and exited on 7/24/2009 at the open.
The code I am providing is not meant to be a complete trading system, as it lacks exits rules and position sizing. More testing should be done to determine the appropriate inputs.
The AIQ code for this indicator can be downloaded from www.TradersEdgeSystems.com/traderstips.htm, and is also shown below.
!APPLYING QUANTITY AND TIME INDICATORS

!Substituted for the July 2013 Traders' Tips Article

!Author: Martha Stokes, TASC Bonus Issue 2013

!Coded by: Richard Denning 5/12/13


!INPUTS:

  ROCLEN is 24.

  MYINDICATOR1 is [volume].

  MYINDICATOR2 is [close].

  STDLEN is 200.

  DEVIATION_STD_MULT is 2.


!LINEAR REGRESSION RATE OF CHANGE INDICATOR1 (VOLUME):

 !GET SLOPE AND INTERCEPT OF LINEAR REGRESSION LINE 1:

   b is slope2(MYINDICATOR1,ROCLEN).

   intercept is sum(MYINDICATOR1,ROCLEN)/

	ROCLEN - (b * (ROCLEN + 1) / 2).

 !END POINT OF LINEAR REGRESSION LINE 1:

   LRV is intercept + (ROCLEN*b).

 !BEGINNING POINT OF LINEAR REGRESSION LINE 1:

   LRVrocLen is intercept + ((ROCLEN-ROCLEN)*b).

 !LINEAR REGRESSION RATE OF CHANGE IN INDICATOR1:

   rocLRind1 is iff(b>0,abs((LRV / LRVrocLen - 1)),

	-abs((LRV / LRVrocLen - 1))) * 100.


!LINEAR REGRESSION RATE OF CHANGE INDICATOR2 (PRICE):

 !GET SLOPE AND INTERCEPT OF LINEAR REGRESSION LINE 2:

   b2 is slope2(MYINDICATOR2,ROCLEN).

   intercept2 is sum(MYINDICATOR2,ROCLEN)/

	ROCLEN - (b2 * (ROCLEN + 1) / 2).

 !GET END POINT OF LINEAR REGRESSION LINE 2:

   LRV2 is intercept2 + (ROCLEN*b2).

 !GET BEGINNING POINT OF LINEAR REGRESSION LINE 2:

   LRVrocLen2 is intercept2 + ((ROCLEN-ROCLEN)*b2).

 !GET LINEAR REGRESSION RATE OF CHANGE IN INDICATOR2:

    rocLRind2 is iff(b2>0,abs((LRV2 / LRVrocLen2 - 1)),

	-abs((LRV2 / LRVrocLen2 - 1))) * 100.


!GET DIVERGENCE BETWEEN ROC OF INDICATOR1 VS INDICATOR2:

  DIFF is rocLRind1 - rocLRind2.

  stdDIFF is sqrt(variance(DIFF,STDLEN)).

  numSTD is DIFF/stdDIFF.                     !PLOT


!START DATE FOR LINEAR REGRESSION LINE:

  startDate is setdate(ROCLEN).


!REPORTS:

  ShowValues if [volume] > 3000 and [close] > 5

    and hasdatafor(max(ROCLEN,STDLEN)+10)>=max(ROCLEN,STDLEN).

  PosDiverg if DIFF > 0

    and numSTD >= DEVIATION_STD_MULT and ShowValues.

  NegDiverg if DIFF < 0

    and numSTD <= -DEVIATION_STD_MULT and ShowValues.
—Richard Denning
info@TradersEdgeSystems.com
for AIQ Systems
BACK TO LIST

TRADERSSTUDIO: JULY 2013 TRADERS’ TIPS CODE
For this month’s Traders’ Tip, I am providing TradersStudio code for an indicator discussed in the Bonus Issue 2013 S&C article by Martha Stokes, “Balancing Your Indicators.”
In the article, Stokes discusses several indicators but focuses on the price versus volume rate of change. She suggests that we look for divergences in price versus volume change. She does not give specific formulas or describe how the indicators should be constructed, nor how the divergence could be mechanized. She only shows examples of the indicators and gives interpretations on a given stock.
To code the indicators, I used a linear regression (LR) of the price compared to linear regression of the volume. We need to take the rate of change of each in order to normalize so that we can compare and find the divergence. I get the LR rate of change of each indicator by using the endpoints of the LR line (endpoint divided by beginning point minus 1).
The TradersStudio code for the indicators is provided at the following websites:
The following code files are contained in the download:
- Function: “LR_SRV” is a function that returns any value along a linear regression line plus other values related to linear regression
- Function: “LR_VAL” is a function that gets a specific value on the linear regression line and uses the LR_SRV function to do so
- Function: “ROC_DIVERG” is a function that returns the number of standard deviations of the difference between two indicator series. I use the volume and close price as the two series.
- Indicator plot: A plotting function that allows the divergence of volume to price indicator to be displayed on a chart with the upper and lower signal lines, which are set to four standard deviations
- System: “PV_DIVERG” is a system I devised to use for testing the divergence indicator.
In Figure 9, I show a trade on Apple (AAPL) with the divergence indicator. When the indicator crosses over the upper four–standard deviation line, a buy signal is given. I optimized just the long side on the NASDAQ 100 stocks and found that the four standard deviation was a relatively good setting. Exits were based on a 10-bar holding period.
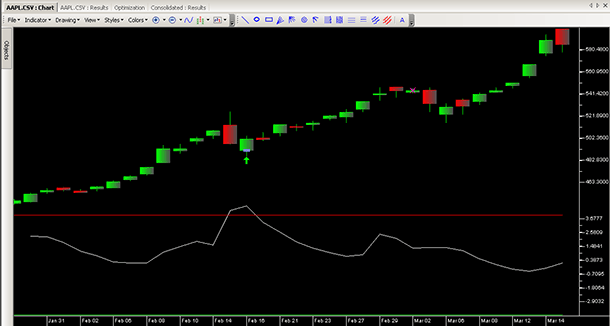
FIGURE 9: TRADERSSTUDIO, VOLUME-PRICE DIVERGENCE INDICATOR. Here is a chart of AAPL with the volume-price divergence indicator and a long trade indicated by the green up arrow.
The system is by no means a finished product that could be traded, but simply a tool to test the effectiveness of the indicator. I did not do enough tests to draw any conclusions. More testing should be done before relying on this indicator for live trading.
The code is as follows:
'APPLYING QUANTITY AND TIME INDICATORS

'Substituted for the July 2013 Traders' Tips Article

'Author: Martha Stokes, TASC Bonus Issue 2013

'Coded by: Richard Denning 5/12/13


'LINEAR REGRESSION FUNCTION

'Parameters


'Y  specifies which price of the asset of interest is To be used

'SLen the number Of trailing bars To consider

'TargetB represents the number Of bars into the future Or back into the past

'Returns a numeric value containing the current value Of the specified regression line at TargetB.

'Changes values of variables rSqrd, slopeR, endVal to those the least squares line computed by the function

' R squared (rSqrd) is the measure of how well the line fits the data (will vary from 0 (no fit) to 1.00 (perfect fit)

' slope (slopeR) is the risk ove run of the line

' endVal is the value of the line at the current bar


'the regression formulas can be checked using the Excel tutorial on linear regression found at:

'https://phoenix.phys.clemson.edu/tutorials/excel/regression.html


Function LR_SRV(Y As BarArray, SLen, TargetB, ByRef rSqrd, ByRef slopeR, ByRef endVal) as bararray

    Dim X, sumX, sumSqrX, sumY, sumSqrY, sumXY, numer, denom1, denom2 As Double

    Dim Slope As Double

    Dim Intercept As Double

    Dim R As Double

    Dim myDate As String

    myDate = FormatDateTime(Date)


 If SLen <= 0 Then

    LR_SRV = 0

 Else

    sumX = 0

    sumSqrX = 0

    sumY = 0

    sumSqrY = 0

    sumXY = 0


    For X = 0 To SLen - 1

        sumX = sumX + X+1

        sumSqrX = sumSqrX + (X+1)*(X+1)

        sumY = sumY + Y[X]

        sumSqrY = sumSqrY + Y[X] * Y[X]

        sumXY = sumXY + (X+1) * Y[SLen-X-1]

    Next


    numer = (SLen * sumXY - sumX * sumY)


  'slope

    denom1 = (SLen * sumSqrX - sumX * sumX)

    If denom1 <> 0 Then

        Slope = numer / denom1

    Else

        Slope = 0

    End If

    slopeR = Slope


  'intercept

    if slen <> 0 then Intercept = (sumY - Slope * sumX) / SLen


  'R squared

    denom2 = (Sqr( (SLen * sumSqrX - sumX*sumX)*(SLen * sumSqrY - (sumY * sumY)) ))

    If denom2 <> 0 Then

        R = numer / denom2

        rSqrd = R * R

    Else

        rSqrd = 0

    End If


  'end value of linear regression line

    endVal = Intercept + Slope * (SLen)


  'projected value of linear regression line at target bar

    LR_SRV = Intercept + Slope * (SLen - 1 - TargetB)


 End If

End Function

'----------------------------------------------------------------------------------

Function LR_VAL(price As BarArray, LRlen, TargetB) As BarArray

    Dim rSqrd,slopeR As Double

    Dim endVal As BarArray

    LR_VAL = LR_SRV(price, LRlen, TargetB, rSqrd, slopeR, endVal)

End Function

'----------------------------------------------------------------------------------

Function ROC_DIVERG(IND1 As BarArray,IND2 As BarArray,ROCLEN,STDLEN,ByRef DIFF)

Dim endPoint1 As BarArray

Dim endPoint2 As BarArray

Dim beginPoint1 As BarArray

Dim beginPoint2 As BarArray

Dim rocIND1 As BarArray

Dim rocIND2 As BarArray

'Dim DIFF As BarArray

endPoint1 = LR_VAL(IND1, ROCLEN, 0)

beginPoint1 = LR_VAL(IND1, ROCLEN, ROCLEN-1)-1

If beginPoint1 <>0 Then rocIND1 = endPoint1 / beginPoint1-1

If beginPoint1 < 0 And endPoint1 > 0 Then rocIND1 = -rocIND1

endPoint2 = LR_VAL(IND2, ROCLEN, 0)

beginPoint2 = LR_VAL(IND2, ROCLEN, ROCLEN-1)-1

if beginpoint2 <> 0 then rocIND2 = endPoint2 / beginPoint2-1

If beginPoint2 < 0 And endPoint2 > 0 Then rocIND2 = -rocIND2

DIFF = rocIND1 - rocIND2

ROC_DIVERG = DIFF / StdDev(DIFF,STDLEN,0)

End Function

'----------------------------------------------------------------------------------

Sub PV_DIVERG_IND(ROCLEN,STDLEN)

Dim pv_diverg As BarArray

Dim DIFF

pv_diverg = ROC_DIVERG(V,C,ROCLEN,STDLEN,DIFF)

plot1(pv_diverg)

plot2(4)

plot3(-4)

End Sub

'-----------------------------------------------------------------------------------

'TRADING SYSTEM FOR TESTING INDICATOR:

Sub PV_DIVERG(ROCLEN,STDLEN,NUMSTD)

'  ROCLEN = 24

'  STDLEN = 200

'  NUMSTD = 4

Dim pv_dvg As BarArray

Dim DIFF

'  IND1 = volume

'  IND2 = close

pv_dvg = ROC_DIVERG(V,C,ROCLEN,STDLEN,DIFF)

If pv_dvg >= NUMSTD And DIFF > 0  Then Buy("LE",1,0,Market,Day)

'If pv_dvg <= -NUMSTD And DIFF < 0 Then Sell("SE",1,0,Market,Day)

If BarsSinceEntry >= 10 Then

    ExitLong("LX","",1,0,Market,Day)

    ExitShort("SX","",1,0,Market,Day)

End If

End Sub

'-----------------------------------------------------------------------------------
—Richard Denning
info@TradersEdgeSystems.com
for TradersStudio
BACK TO LIST

UPDATA: JULY 2013 TRADERS’ TIPS CODE
Our Traders’ Tip for this month is based on the article by Sylvain Vervoort in this issue, “The Step Candle Pattern” (Figure 10).
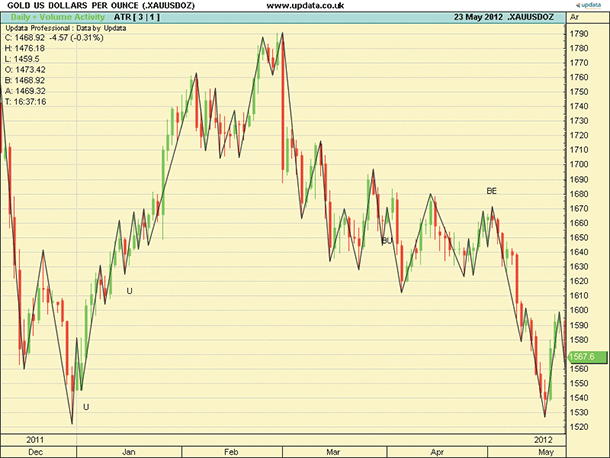
FIGURE 10: UPDATA. A chart of daily gold prices is shown with the step pattern indicator applied. Shown are two upstep (U) candles followed by bullish engulfing (BU) and bearish englufing (BE) candles.
In the article, Vervoort delivers some rules for swing trading based on counting common wave patterns and candle patterns in financial data. The Updata code shown here deals with transitions between upwaves and downwaves via the breaking of some ATR-based thresholds. Vervoort’s upstep/downstep candle patterns are highlighted as text at the junctions of these transitions.
The Updata code for this indicator has been added to the Updata library and may be downloaded by clicking the custom menu and then “Indicator library.” Those who cannot access the library due to a firewall may paste the code shown below into the Updata custom editor and save it.
'The Step Candle Pattern
PARAMETER "ATR Period" #PERIOD=5
PARAMETER "ATR Mult." @MULT=1.5
DISPLAYSTYLE LINE
INDICATORTYPE TOOL
NAME "ATR [" #PERIOD "|" @MULT "]" ""
@PeriodHighPrice=0
@PeriodLowPrice=0
#PeriodHighBars=0
#PeriodLowBars=0
@MODE=0
@HLPivot=0
@StepUp=0
@StepDn=0
'List of pre-written candle patterns
'Over 40 different patterns available
'$ Refers prefix accesses Highlighter Library
$High_BE=BearishEngulfing.HIG
$High_BU=BullishEngulfing.HIG

FOR #CURDATE=#LASTDATE-500 TO #LASTDATE

   'Step Up Pattern
   If Close<Open AND Close(1)>Open(1) AND Open(1)>=Close AND Open(1)<=Open AND Close(1)>Open
      @StepUp=1
   ElseIf Close(1)<Open(1) AND Close(2)>Open(2) AND Open(2)>=Close(1) AND Open(2)<=Open(1) AND Close(2)>Open(1)
      @StepUp=1
   ElseIf Close>Open AND Close(1)>Open(1) AND Open(1)>=Open AND Open(1)<=Close AND Close(1)>Close
      @StepUp=1
   ElseIf Close(1)>Open(1) AND Close(2)>Open(2) AND Open(2)>=Open(1) AND Open(2)<=Close(1) AND Close(2)>Close(1)
      @StepUp=1
   Else
      @StepUp=0
   EndIf
   'Step Down Pattern
   If Close<Open AND Close(1)<Open(1) AND Open(1)<=Close AND Open(1)>=Open AND Close(1)<Open
      @StepDn=1
   ElseIf Close(1)<Open(1) AND Close(2)<Open(2) AND Open(2)<=Close(1) AND Open(2)>=Open(1) AND Close(2)<Open(1)
      @StepDn=1
   ElseIf Close>Open AND Close(1)<Open(1) AND Open(1)<=Open AND Open(1)>=Close AND Close(1)<Close
      @StepDn=1
   ElseIf Close(1)>Open(1) AND Close(2)<Open(2) AND Open(2)<=Open(1) AND Open(2)>=Close(1) AND Close(2)<Close(1)
      @StepDn=1
   Else
      @StepDn=0
   EndIf
   #PeriodHighBars=#PeriodHighBars+1
   #PeriodLowBars=#PeriodLowBars+1
   @HLPivot=@MULT*ATR(#PERIOD)/CLOSE
   If @MODE>0
      If HIGH>PHIGH(HIGH(1),#PERIOD)
         @PeriodHighPrice=HIGH
         #PeriodHighBars=1
      ElseIf LOW<@PeriodHighPrice-(@PeriodHighPrice*@HLPivot)
         @PeriodLowPrice=LOW
         DRAWLINE #PeriodHighBars-1,@PeriodHighPrice,#PeriodLowBars-1,LOW(#PeriodLowBars-1)
         #PeriodLowBars=1
         @MODE=-1
         'Annotate Chart With Pre-Written Candle Patterns
         IF @StepDn>0
            DRAWTEXT @PeriodHighPrice ABOVE "D"
         ENDIF
         IF HIGHLIGHTER($High_BE)=TRUE
            DRAWTEXT HIGH ABOVE "BE"
         ENDIF
         IF HIGHLIGHTER($High_BU)=TRUE
            DRAWTEXT LOW BELOW "BU"
         ENDIF
      EndIf
   Else
      If LOW<PLOW(LOW(1),#PERIOD)
         @PeriodLowPrice=LOW
         #PeriodLowBars=1
      ElseIf HIGH>@PeriodLowPrice+(@PeriodlowPrice*@HLPivot)
         @PeriodHighPrice=HIGH
         DRAWLINE #PeriodLowBars-1,@PeriodLowPrice,#PeriodHighBars-1,HIGH(#PeriodHighBars-1)
         #PeriodHighBars=1
         'Annotate Chart With Pre-Written Candle Patterns
         IF @StepUp>0
            DRAWTEXT @PeriodLowPrice BELOW "U"
         ENDIF
         IF HIGHLIGHTER($High_BE)=TRUE
            DRAWTEXT HIGH ABOVE "BE"
         ENDIF
         IF HIGHLIGHTER($High_BU)=TRUE
            DRAWTEXT LOW BELOW "BU"
         ENDIF
         @MODE=1
      EndIf
   EndIf
NEXT
—Updata support team
support@updata.co.uk
www.updata.co.uk
BACK TO LIST

TRADESIGNAL: JULY 2013 TRADERS’ TIPS CODE
The indicators presented by Sylvain Vervoort in his article in this issue, “The Step Candle Pattern,” can easily be used with our online charting tool at www.tradesignalonline.com. Just check the Infopedia section for our lexicon. There, you will see the indicator and the functions, which you can make available for your personal account. Click on it and select “open script.” You can then apply the indicator to any chart you wish (Figure 11).
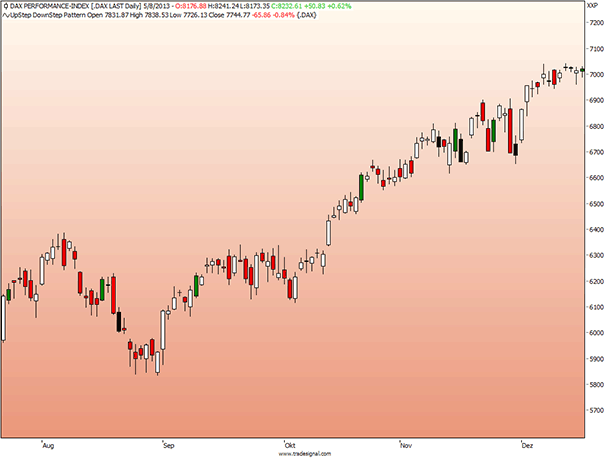
FIGURE 11: TRADESIGNAL ONLINE. The upstep/downstep pattern indicator is shown on a daily chart of the German DAX.
Meta:

	Subchart( False ),

	Weblink("https://www.tradesignalonline.com/lexicon/edit.aspx?id=19921");


Inputs:

	Bullish_Color( DarkGreen ),

	Bearish_Color( Black );


Vars:

	bullCandle, bearCandle, upStepPattern, downStepPattern;


bullCandle = Close > Open;

bearCandle = Close < Open;


upStepPattern = ( bearCandle[1] And bullCandle And Open >= Close[1] And Open < Open[1] And Close > Open[1] And Low[1] < Low[2] And Low > Low[1] ) Or

				( bullCandle[1] And bullCandle And Open < Close[1] And Open >= Open[1] And Close > Close[1] And Low[1] < Low[2] And Low > Low[1] ) Or

				( bearCandle[1] And bullCandle And Open >= Close[1] And Open < Open[1] And Close > Open[1] And Low[1] < Low[2] And Low < Low[1] ) Or

				( bullCandle[1] And bullCandle And Open < Close[1] And Open >= Open[1] And Close > Close[1] And Low[1] < Low[2] And Low < Low[1] );


downStepPattern = ( bullCandle[1] And bearCandle And Open <= Close[1] And Open > Open[1] And Close < Open[1] And High[1] > High[2] And High < High[1] ) Or

					( bearCandle[1] And bearCandle And Open <= Open[1] And Open > Close[1] And Close < Close[1] And High[1] > High[2] And High < High[1] ) Or

					( bullCandle[1] And bearCandle And Open <= Close[1] And Open > Open[1] And Close < Open[1] And High[1] > High[2] And High > High[1] ) Or

					( bearCandle[1] And bearCandle And Open <= Open[1] And Open > Close[1] And Close < Close[1] And High[1] > High[2] And High > High[1] );


If upStepPattern Then

	DrawCandlestick( Open, High, Low, Close, Bullish_Color, Bullish_Color, Black )

Else if downStepPattern Then

	DrawCandlestick( Open, High, Low, Close, Bearish_Color, Bearish_Color, Black );


// *** Copyright tradesignal GmbH ***

// *** www.tradesignal.com ***
—Henning Blumenthal, Tradesignal GmbH
support@tradesignalonline.com
www.TradesignalOnline.com, www.Tradesignal.com
BACK TO LIST
MICROSOFT EXCEL: JULY 2013 TRADERS’ TIPS CODE
In “The Step Candle Pattern” in this issue, author Sylvain Vervoort builds on the zigzag indicator presented last month in his June 2013 article (“The 1-2-3 Wave Count”) and adds the ability to identify three specific candle types at the zigzag turning points.
In the NinjaTrader code that accompanies Vervoort’s article in this issue, Vervoort identifies four specific candle patterns. Next, he treats body gap patterns as an extension of his step patterns and uses the same pattern identifier on the chart for both types.
Being a curious sort, I chose to have the body gap pattern set the step pattern flag per Vervoort’s example. I also set a unique flag for body gaps. So my on-chart indicator is designed to show the possible occurrences of all four types: step, body gap, harami, and engulfing.
As it was with last month’s Traders’ Tip, the zigzag is still time-consuming to create. But the pattern identification is fast and only takes place for reversals identified by the zigzag logic. Thus, adding this the pattern identification function to the spreadsheet does not add any significant delay to the zigzag refresh time.
With a completed zigzag displayed on the chart, the checkboxes to the right of the chart can be used to dynamically show or hide the individual pattern indicators.
Figure 12 approximates the data interval shown in Figure 6 of Vervoort’s article in this issue. It also conveniently contains examples of all four of the turning point candle patterns referenced in the article and the NinjaTrader code.
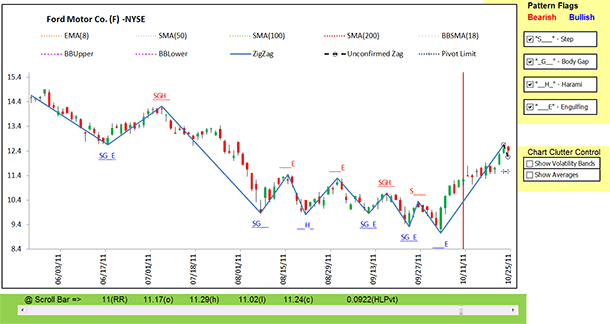
FIGURE 12: EXCEL. This sample chart shows a zigzag plot with candle pattern indicators.
The spreadsheet file for this Traders’ Tip can be downloaded here. To successfully download it, follow these steps:
- Right-click on the Excel file link, then
- Select “Save target as” to place a copy of the spreadsheet file on your hard drive.
—Ron McAllister
Excel and VBA programmer
rpmac_xltt@sprynet.com
BACK TO LIST

TRADING BLOX: JULY 2013 TRADERS’ TIPS CODE
In “The Step Candle Pattern” in this issue, author Sylvain Vervoort presents a set of candlestick patterns that appear at turning points. These patterns are meant to be used as additional confirmations to the 1-2-3 wave count technique he introduced last month in his June 2013 S&C article. By adding these patterns to our existing system, we are essentially filtering out trade entries that are least likely to move in our favor. Naturally, this will reduce the number of trades in our test in an effort to increase performance and reduce drawdowns.
We added the candlestick patterns to the system based on the 1-2-3 wave count that we created last month in Traders’ Tips for Vervoort’s June 2013 article, looking for a confirmation of the start of a wave 1 or 3 along with a close outside of the two–standard deviation Bollinger Band, and exiting on the built-in Trading Blox chandelier exit (Figure 13). Conditions for entry are shown in Figure 14.
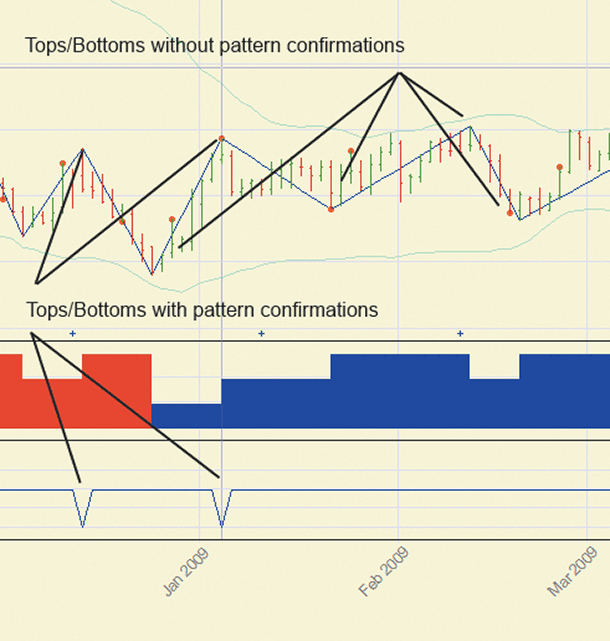
FIGURE 13: TRADING BLOX, SWINGS. Pattern confirmations are marked by the blue line seen at the bottom at the chart.
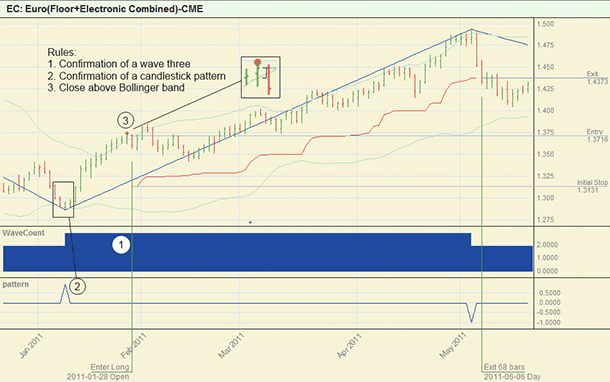
FIGURE 14: TRADING BLOX, SWING TRADING RULES. Conditions for entry are shown for the trade in Figure 13.
We are also including the performance from the system without the candlestick patterns for reference (Figure 15).
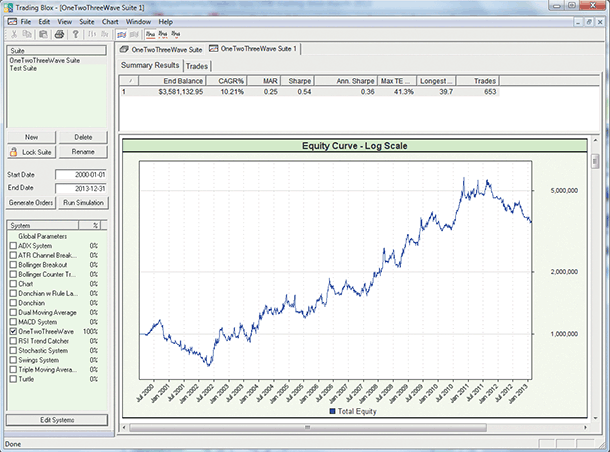
FIGURE 15: TRADING BLOX, SYSTEM WITHOUT CANDLESTICK PATTERN CONFIRMATION. Performance results for Sylvain Vervoort’s 1-2-3 wave system are shown here without pattern confirmations.
As can be seen in the performance results shown in Figure 16, adding the pattern confirmations to the entry rules reduces the number of trades almost by half, but in doing so, we can see a slight increase in returns and a significant reduction in the maximum drawdown experienced.
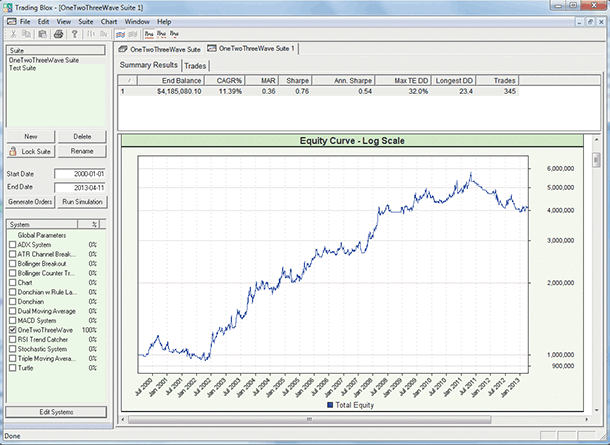
FIGURE 16: TRADING BLOX, SYSTEM WITH CANDLESTICK PATTERN CONFIRMATION. Performance results for Sylvain Vervoort’s 1-2-3 wave system are shown here with candlestick pattern confirmations.
A zipped file of the 123waveCount system Trading Blox files is available here.
—Trading Blox
tradingblox.com
BACK TO LIST
Originally published in the July 2013 issue of
Technical Analysis of Stocks & Commodities magazine.
All rights reserved. © Copyright 2013, Technical Analysis, Inc.
Return to
Contents


