TRADERS’ TIPS
December 2013

For this month’s Traders’ Tips, the focus is Donald Pendergast’s article in this issue, “Swing Trading With Three Indicators.” Here we present the December 2013 Traders’ Tips code with possible implementations in various software.
In his article, Pendergast uses TradeStation to implement his technique, and although no code is provided in the article, a template for the strategy is given.
Traders’ Tips code is provided in this column to help the reader implement a selected technique from an article in this issue. The entries are contributed by various software developers or programmers for software that is capable of customization.

TRADESTATION: DECEMBER 2013 TRADERS’ TIPS CODE
In “Swing Trading With Three Indicators” in this issue, author Donald Pendergast describes a trading system based on three of TradeStation’s built-in indicators.
We have combined the individual indicators as well as the author’s trading rules into a single indicator. By creating a single indicator, we are able to easily highlight entry & exit points on the chart as well as trigger alerts. This also allows us to apply the indicator to TradeStation Scanner to search through any symbol list for trade signals.
We have also provided a strategy to allow users to quickly and easily backtest historical performance on the symbols of their choice using TradeStation’s backtesting engine.
To download the EasyLanguage code, visit the TradeStation and EasyLanguage support forum. The code from this article can be found at https://www.tradestation.com/TASC-2013. The ELD filename is “_TASC_SwingTrading3.ELD.”
For more information about EasyLanguage, see https://www.tradestation.com/EL-FAQ.
A sample chart is shown in Figure 1.
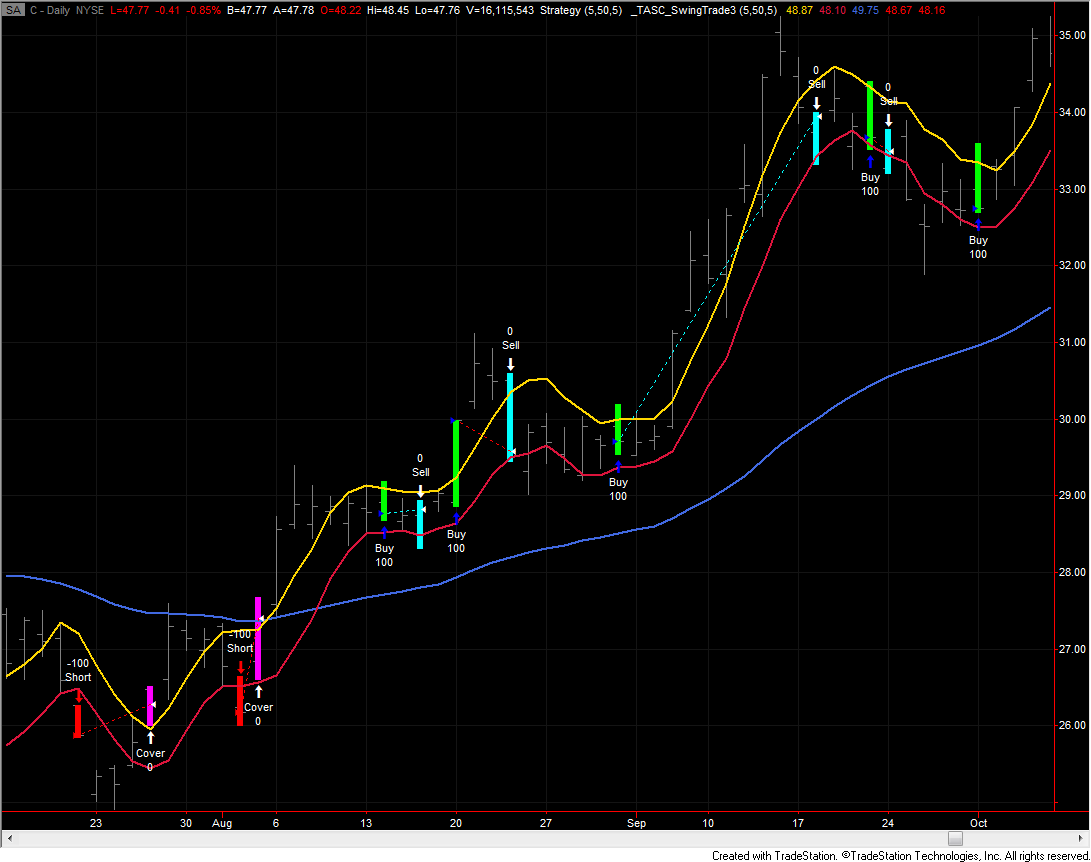
FIGURE 1: TRADESTATION. Here is a daily chart of Citigroup with the referenced indicator and strategy applied.
inputs:
	SMALength( 5 ),
	EMALength( 50 ),
	BreakOutTicks( 5 ) ;

variables:
	SMAHighValue( 0 ),
	SMALowValue( 0 ),
	EMAValue( 0 ),
	ATick( 0 ),
	PositionState( 0 ) ;

once
	begin
	ATick = MinMove / PriceScale ;
	end ;

SMAHighValue = Average( High, SMALength ) ;
SMALowValue = Average( Low, SMALength ) ;
EMAValue = XAverage( Close, EMALength ) ;

Plot1( SMAHighValue, "SMAHighs",
	RGB( 255, 215, 0 ) ) ;
Plot2( SMALowValue, "SMALows",
	RGB( 220, 20, 60 ) ) ;
Plot3( EMAValue, "EMA",
	RGB( 65, 105, 225 ) ) ;

if PositionState = 0 then
	begin
	if Close[1] > EMAValue[1]
		and High crosses over
		SMAHighValue + BreakOutTicks * ATick then
			begin
			PositionState = 1 ;
			Plot4( High, "SignalH", Green ) ;
			Plot5( Low, "SignalL", Green ) ;
			Alert ;
			end
	else if Close[1] < EMAValue[1]
		and Low crosses under
		SMALowValue - BreakOutTicks * ATick then
			begin
			PositionState = -1 ;
			Plot4( High, "SignalH", Red ) ;
			Plot5( Low, "SignalL", Red ) ;
			Alert ;
			end ;
	end
else
	begin
	if PositionState = 1
		and Low < SMALowValue then
		begin
		PositionState = 0 ;
		Plot4( High, "SignalH", Cyan ) ;
		Plot5( Low, "SignalL", Cyan ) ;
		end
	else if PositionState = -1
		and High > SMAHighValue then
		begin
		PositionState = 0 ;
		Plot4( High, "SignalH", Magenta ) ;
		Plot5( Low, "SignalL", Magenta ) ;
		end ;
	end ;


inputs:
	SMALength( 5 ),
	EMALength( 50 ),
	BreakOutTicks( 5 ) ;

variables:
	SMAHighValue( 0 ),
	SMALowValue( 0 ),
	EMAValue( 0 ),
	ATick( 0 ) ;


once
	begin
	ATick = MinMove / PriceScale ;
	end ;

SMAHighValue = Average( High, SMALength ) ;
SMALowValue = Average( Low, SMALength ) ;
EMAValue = XAverage( Close, EMALength ) ;

if Close[1] > EMAValue[1]
	and High crosses over
	SMAHighValue + BreakOutTicks * ATick then
			Buy this bar on Close
else if Close[1] < EMAValue[1]
	and Low crosses under
	SMALowValue - BreakOutTicks * ATick then
		SellShort this bar on Close ;

if Low < SMALowValue and MarketPosition = 1 then
		Sell this bar on Close ;
if High > SMAHighValue and MarketPosition = -1 then
		BuyToCover this bar on Close ;
This article is for informational purposes. No type of trading or investment recommendation, advice, or strategy is being made, given, or in any manner provided by TradeStation Securities or its affiliates.
—Doug McCrary
TradeStation Securities, Inc.
www.TradeStation.com
BACK TO LIST

eSIGNAL: DECEMBER 2013 TRADERS’ TIPS CODE
For this month’s Traders’ Tip, we’ve provided the formula 3MA_TradingTemplate.efs based on the strategy described in “Swing Trading With Three Indicators” by Donald Pendergast in this issue.
The study contains formula parameters to set the values for the number of ticks, EMA length, and entry & exit label colors, which may be configured through the edit chart window (right-click on chart and select edit chart).
To discuss this study or download a complete copy of the formula code, please visit the EFS Library Discussion Board forum under the Forums link from the support menu at www.esignal.com or visit our EFS KnowledgeBase at https://www.esignal.com/support/kb/efs/. The eSignal formula scripts (EFS) are also available for copying and pasting below.
/*********************************
Provided By:
    Interactive Data Corporation (Copyright © 2013)
    All rights reserved. This sample eSignal Formula Script (EFS)
    is for educational purposes only. Interactive Data Corporation
    reserves the right to modify and overwrite this EFS file with
    each new release.

Description:
    Swing trading with three indicators

Version:            1.00  10/07/2013

Formula Parameters:                     Default:
Number of Ticks                         5
EMA Length                              50
Entry Long Position                     lime
Entry Short Position                    red

Exit Position                           paleyellow

Notes:
    The related article is copyrighted material. If you are not a subscriber
    of Stocks & Commodities, please visit www.traders.com.

**********************************/

var fpArray = new Array();

function preMain()
{
    setStudyTitle("3MA_TradingTemplate");
    setPriceStudy(true);


    setCursorLabelName("MA(high)", 0);

    setCursorLabelName("MA(low)", 1);

    setCursorLabelName("EMA", 2);


    setDefaultBarFgColor(Color.RGB(255, 155, 0), 0);
    setDefaultBarFgColor(Color.red, 1);
    setDefaultBarFgColor(Color.blue, 2);


    setDefaultBarThickness(2, 0);

    setDefaultBarThickness(2, 1);

    setDefaultBarThickness(2, 2);

    var x = 0;

    fpArray[x] = new FunctionParameter("fpNumberTicks", FunctionParameter.NUMBER);
    with(fpArray[x++])
    {
        setName("Number of Ticks");
        setLowerLimit(1);
        setDefault(5);
    }

    fpArray[x] = new FunctionParameter("fpEMALength", FunctionParameter.NUMBER);
    with(fpArray[x++])
    {
        setName("EMA Length");
        setLowerLimit(1);
        setDefault(50);
    }

    fpArray[x] = new FunctionParameter("fpEntryLongColor", FunctionParameter.COLOR);
    with(fpArray[x++])
    {
        setName("Entry Long Position");
        setDefault(Color.lime);
    }

    fpArray[x] = new FunctionParameter("fpEntryShortColor", FunctionParameter.COLOR);
    with(fpArray[x++])
    {
        setName("Entry Short Position");
        setDefault(Color.red);
    }


    fpArray[x] = new FunctionParameter("fpExitColor", FunctionParameter.COLOR);
    with(fpArray[x++])
    {
        setName("Exit Position");
        setDefault(Color.paleyellow  );
    }
}

var bInit = false;
var bVersion = null;

var xClose = null;

var xOpen = null;

var xHigh = null;

var xLow = null;


var xMA_highs = null;

var xMA_lows = null;

var xEMA = null;


var nTick = 0;

function main(fpNumberTicks, fpEMALength, fpEntryLongColor, fpEntryShortColor, fpExitColor)
{
    if (bVersion == null) bVersion = verify();
    if (bVersion == false) return;


    if (!bInit)
    {
    	xClose = close();

        xOpen = open();

        xHigh = high();

        xLow = low();


        xMA_highs = sma(5, xHigh);

        xMA_lows = sma(5, xLow);

        xEMA = ema(fpEMALength);


        nTick = getMinTick();

        bInit = true;
    }


    var nClose = xClose.getValue(-1);

    var nOpen = xOpen.getValue(0);

    var nHigh = xHigh.getValue(0);

    var nLow = xLow.getValue(0);


    var nMA_highs = xMA_highs.getValue(0);

    var nMA_lows = xMA_lows.getValue(0);

    var nEMA = xEMA.getValue(0);


    if (nMA_highs == null || nMA_lows == null || nEMA == null)

        return;


    if (getCurrentBarIndex() != 0)
    {
        var bFStrategy = Strategy.isInTrade();
        var bLStrategy = Strategy.isLong();
        var bSStrategy = Strategy.isShort();


        var nLotSize = Strategy.getDefaultLotSize();

        var nFillPrice = 0;


        if (!bFStrategy)
        {

            if ((nHigh > nMA_highs + (fpNumberTicks * nTick)) && (nClose > nEMA))

            {

                nFillPrice = Math.max(nOpen, nMA_highs + (fpNumberTicks * nTick));

                Strategy.doLong("Enter Long", Strategy.STOP, Strategy.THISBAR, Strategy.DEFAULT, nFillPrice);
                drawTextRelative(0, AboveBar3, "Enter Long", Color.black, fpEntryLongColor, Text.PRESET, null, null, getCurrentBarIndex()+"action");
                drawTextRelative(0, AboveBar2, nLotSize + " @ " + formatPriceNumber(nFillPrice), Color.black, fpEntryLongColor, Text.PRESET, null, null, getCurrentBarIndex()+"price");
                drawShapeRelative(0, AboveBar1, 10, null, Color.blue, Shape.PRESET, null);
            }


            if ((nLow < nMA_lows - (fpNumberTicks * nTick)) && (nClose < nEMA))

            {

                nFillPrice = Math.min(nOpen, nMA_lows - (fpNumberTicks * nTick));

                Strategy.doShort("Enter Short", Strategy.STOP, Strategy.THISBAR, Strategy.DEFAULT, nFillPrice);
                drawTextRelative(0, AboveBar3, "Enter Short", Color.black, fpEntryShortColor, Text.PRESET, null, null, getCurrentBarIndex()+"action");
                drawTextRelative(0, AboveBar2, nLotSize + " @ " + formatPriceNumber(nFillPrice), Color.black, fpEntryShortColor, Text.PRESET, null, null, getCurrentBarIndex()+"price");
                drawShapeRelative(0, AboveBar1, 10, null, Color.blue, Shape.PRESET, null);
            }

        }


        if ((bLStrategy) && (nLow < nMA_lows))
        {
            nFillPrice = Math.min(nOpen, nMA_lows);

            Strategy.doSell("Exit Long", Strategy.STOP, Strategy.THISBAR, Strategy.DEFAULT, nFillPrice);
            drawTextRelative(0, BelowBar2, "Exit Long", Color.black, fpExitColor, Text.PRESET, null, null, getCurrentBarIndex()+"action");
            drawTextRelative(0, BelowBar3, nLotSize + " @ " + formatPriceNumber(nFillPrice), Color.black, fpExitColor, Text.PRESET, null, null, getCurrentBarIndex()+"price");
            drawShapeRelative(0, BelowBar1, 9, null, Color.blue, Shape.PRESET, null);
        }


        if ((bSStrategy) && (nHigh > nMA_highs))
        {
            nFillPrice = Math.max(nOpen, nMA_highs);
            Strategy.doCover("Exit Short", Strategy.STOP, Strategy.THISBAR, Strategy.DEFAULT, nFillPrice);
            drawTextRelative(0, BelowBar2, "Exit Short", Color.black, fpExitColor, Text.PRESET, null, null, getCurrentBarIndex()+"action");
            drawTextRelative(0, BelowBar3, nLotSize + " @ " + formatPriceNumber(nFillPrice), Color.black, fpExitColor, Text.PRESET, null, null, getCurrentBarIndex()+"price");
            drawShapeRelative(0, BelowBar1, 9, null, Color.blue, Shape.PRESET, null);
        }

    }


    return [nMA_highs, nMA_lows, nEMA];
}

function verify()
{
    var b = false;
    if (getBuildNumber() < 779)
    {
        drawTextAbsolute(5, 35, "This study requires version 8.0 or later.",
            Color.white, Color.blue, Text.RELATIVETOBOTTOM|Text.RELATIVETOLEFT|Text.BOLD|Text.LEFT,
            null, 13, "error");
        drawTextAbsolute(5, 20, "Click HERE to upgrade.@URL=https://www.esignal.com/download/default.asp",
            Color.white, Color.blue, Text.RELATIVETOBOTTOM|Text.RELATIVETOLEFT|Text.BOLD|Text.LEFT,
            null, 13, "upgrade");
        return b;
    }
    else
    {
        b = true;
    }

    return b;
}
A sample chart is shown in Figure 2.
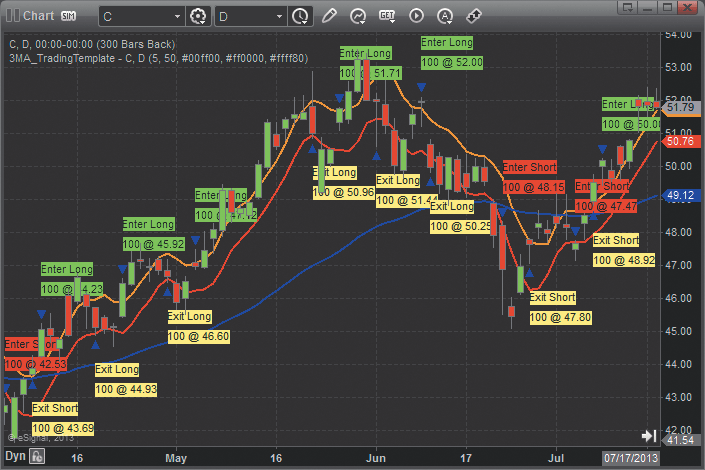
FIGURE 2: eSIGNAL. This month’s eSignal formula strategy, “3MA_TradingTemplate.efs,” is based on Donald Pendergast’s article in this issue, “Swing Trading With Three Indicators.”
—Jason Keck
eSignal, an Interactive Data company
800 779-6555, www.eSignal.com
BACK TO LIST

THINKORSWIM: DECEMBER 2013 TRADERS’ TIPS CODE
In “Swing Trading With Three Indicators” in this issue, author Donald Pendergast explains a simple trading system that can be used by any type of trader. This logical method uses moving averages for indication and confirmation. For thinkorswim users, we have created a strategy in our proprietary scripting language, thinkScript. You can adjust the parameters of these within the edit studies window to fine-tune your periods calculated.
The strategy:
- From TOS charts, select Studies → Edit studies
- Select the Strategy tab in the upper left-hand corner
- Select “New” in the lower left-hand corner
- Name the strategy (such as “SVEZLRBPercB”)
- Click in the script editor window, remove “addOrder(OrderType.BUY_AUTO, no);” and paste in the following code:
input smaLength = 5;
input emaLength = 50;
input tickSizes = 5.0;

def ema = ExpAverage(close, emaLength);
def smaHigh = Average(high, smaLength);
def smaLow = Average(low, smaLength);
def offset = tickSizes * TickSize();

AddOrder(OrderType.BUY_TO_OPEN, close > smaHigh + offset and close[1] > ema, tickcolor = GetColor(0), arrowcolor = GetColor(0), name = "SwingThreeLE");
AddOrder(OrderType.SELL_TO_CLOSE, low <= smaLow, tickcolor = GetColor(1), arrowcolor = GetColor(1), name = "SwingThreeLX");
AddOrder(OrderType.SELL_TO_OPEN, close < smaLow - offset and close[1] < ema, tickcolor = GetColor(2), arrowcolor = GetColor(2), name = "SwingThreeSE");
AddOrder(OrderType.BUY_TO_CLOSE, high >= smaHigh, tickcolor = GetColor(3), arrowcolor = GetColor(3), name = "SwingThreeSX");
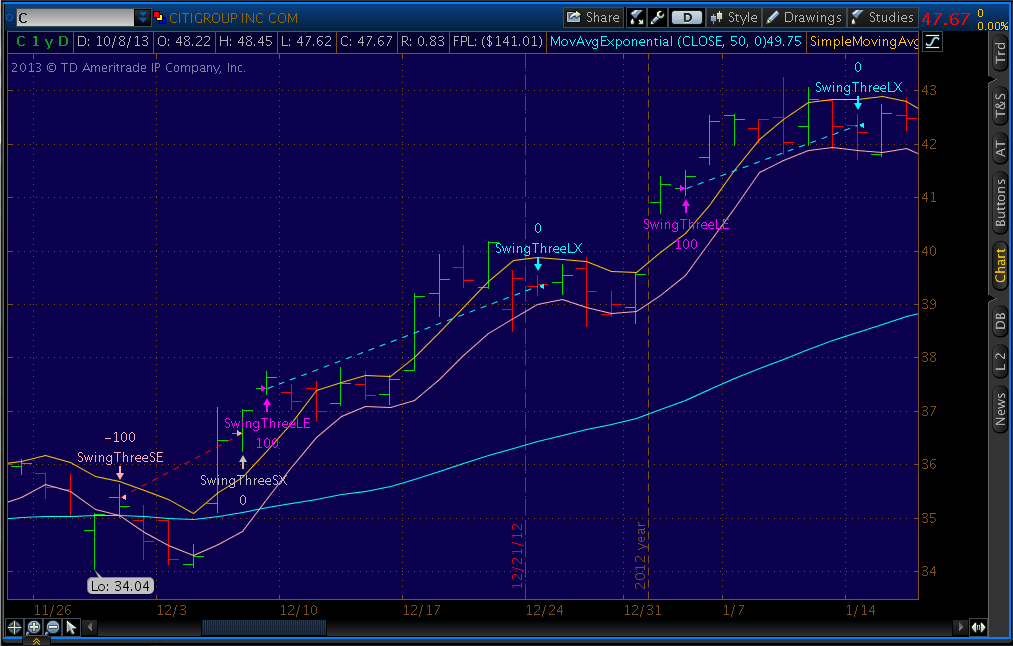
FIGURE 3: THINKORSWIM. Here is an example strategy implemented in thinkorswim based on Donald Pendergast’s article in this issue.
—thinkorswim
A division of TD Ameritrade, Inc.
www.thinkorswim.com
BACK TO LIST

WEALTH-LAB: DECEMBER 2013 TRADERS’ TIPS CODE
The entry-level system featured in “Swing Trading With Three Indicators” by Donald Pendergast in this issue appears to be a variation of the Kestner moving average system described in Quantitative Trading Strategies by Lars Kestner.
In his article in this issue, Pendergast emphasizes market selection, which we believe is a key to success, together with position sizing and a sound exit strategy. This explains why the results we got when backtesting the original rules on a portfolio without any market selection strategy (based on the Dow 30 stocks, five years of daily data, 5% equity per trade, no trading costs) were far from optimal. The system was very trigger-happy, had a considerable drawdown, and was losing on the short side.
How can the results be improved? As Pendergast suggests, the periods of the moving averages can be optimized. It might seem like a natural move, but we'll approach it from a different angle — we’ll leave the parameters as is and add a couple of trade filters that will be simple enough to be in line with the logical and straightforward nature of this swing trading system. The filters are as follows:
Filter 1: The first filter confirms the overall direction of the market’s trend by taking long entries only if a 50-day high was made more recently than a 50-day low (and vice versa for short trades). We believe this might minimize the entries in choppy markets.
Filter 2: The second filter further avoids exposure to range-bound conditions by requiring a temporary reaction — such as a short downward movement after a period of rally — before entering on a breakout. For long trades, we require the number of consecutive bars when the high was below the five-day moving average of highs for two bars in a row (or, for short trades, the number of consecutive bars when the low has been above the five-day moving average of lows for two bars in a row).
The resulting system (Figure 4) fires considerably fewer trades and appears superior from a risk/reward standpoint. To run the strategy code with the tweaked swing trading system, Wealth-Lab users will need to install the latest version of our Community Indicators library from the extensions section of our website if they haven’t already done so, and restart Wealth-Lab.
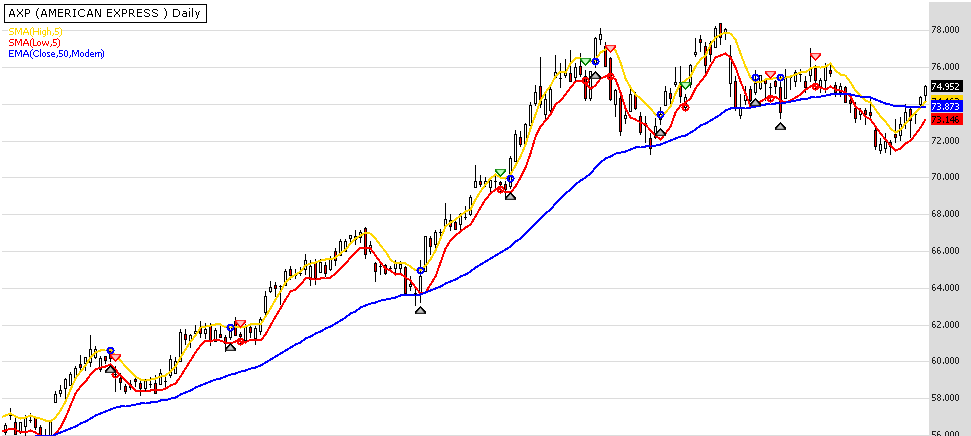
FIGURE 4: WEALTH-LAB. This Wealth-Lab 6 chart illustrates the tweaked system’s rules on a daily chart of American Express (AXP).
C# Code

using System;
using System.Collections.Generic;
using System.Text;
using System.Drawing;
using WealthLab;
using WealthLab.Indicators;
using Community.Indicators;

namespace WealthLab.Strategies
{
	public class PendergastStrategy : WealthScript
	{
		protected override void Execute()
		{
			double tick = Bars.SymbolInfo.Tick;
			DataSeries ema50 = EMAModern.Series(Close, 50);
			SMA maH = SMA.Series(High, 5);
			SMA maL = SMA.Series(Low, 5);
			HighestBar h = HighestBar.Series( High, 50 );
			LowestBar l = LowestBar.Series( Low, 50 );
			SeriesIsAbove risingLows = SeriesIsAbove.Series( Low, maL, 1);
			SeriesIsBelow decliningHighs = SeriesIsBelow.Series( High, maH, 1);

			HideVolume();
			PlotSeries(PricePane,maH,Color.Gold,LineStyle.Solid,2);
			PlotSeries(PricePane,maL,Color.Red,LineStyle.Solid,2);
			PlotSeries(PricePane,ema50,Color.Blue,LineStyle.Solid,2);

			for(int bar = GetTradingLoopStartBar(51); bar < Bars.Count; bar++)
			{
				if (IsLastPositionActive)
				{
					Position p = LastPosition;
					if (p.PositionType == PositionType.Short)
						CoverAtStop( bar + 1, p, maH[bar] );
					else
						SellAtStop( bar + 1, p, maL[bar] );
				}
				else
				{
					if( decliningHighs[bar] >= 2 )
						if( h[bar] > l[bar] )
							if (Close[bar] > ema50[bar])
								BuyAtStop(bar + 1, maH[bar] + 5 * tick);

					if( risingLows[bar] >= 2 )
						if( l[bar] > h[bar] )
							if (Close[bar] < ema50[bar])
								ShortAtStop(bar + 1, maL[bar] - 5 * tick );
				}
			}
		}
	}
}
—Wealth-Lab team
MS123, LLC
www.wealth-lab.com
BACK TO LIST

METASTOCK: DECEMBER 2013 TRADERS’ TIPS CODE
Donald Pendergast’s article in this issue, “Swing Trading With Three Indicators,” presents an easy-to-understand trading system. The system template he provides is also easy to create for visually scanning charts, but it is not as helpful with large groups of trading candidates. The MetaStock formulas provided here can be used to create MetaStock explorations, an expert advisor, and/or a system test:
Buy:
incr:= 0.05;  {amount above/below bands for entry signal}
H > Mov(H, 5, S) AND C > Mov(C, 50, E)

Sell:
L < Mov(L, 5, S)

Sell short:
incr:= 0.05;  {amount above/below bands for entry signal}
L < Mov(L, 5, S) AND C < Mov(C, 50, E)

Cover:
H > Mov(H, 5, S)
—William Golson
MetaStock Technical Support
www.metastock.com
BACK TO LIST

NEUROSHELL TRADER: DECEMBER 2013 TRADERS’ TIPS CODE
The swing trading system described by Donald Pendergast in his article in this issue, “Swing Trading With Three Indicators,” can be easily implemented with a few of NeuroShell Trader’s 800+ indicators. Simply select “New trading strategy” from the Insert menu and enter the following formulas in the appropriate locations of the Trading Strategy Wizard:
Generate a buy long STOP order if all of the following are true:
A>B(Close,ExpAvg(Close,50))
Stop Price: Add2(Avg(High,5),0.05)
Generate a long protective stop order at the following price levels:
Avg(Low,5)
Generate a sell short STOP order if all of the following are true:
A<B(Close,ExpAvg(Close,50))
Stop Price: Sub(Avg(High,5),0.05)
Generate a short protective stop order at the following price level:
Avg(High,5)
If you have NeuroShell Trader Professional, you can also choose whether the parameters should be optimized. After backtesting the trading strategy, use the “Detailed analysis” button to view the backtest and trade-by-trade statistics for the strategy.
Users of NeuroShell Trader can go to the Stocks & Commodities section of the NeuroShell Trader free technical support website to download a copy of this or any previous Traders’ Tips.
A sample chart is shown in Figure 5.
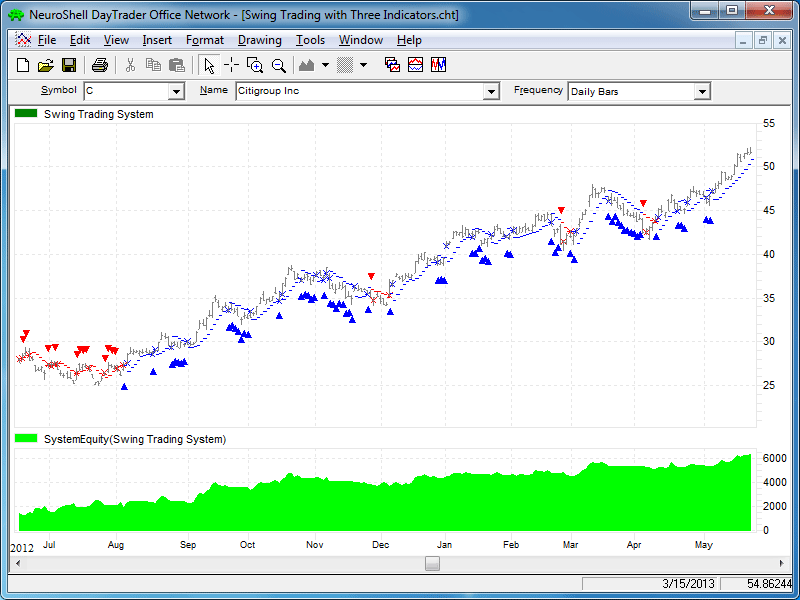
FIGURE 5: NEUROSHELL TRADER. This NeuroShell Trader chart displays the three-indicator swing trading system.
—Marge Sherald, Ward Systems Group, Inc.
301 662-7950, sales@wardsystems.com
www.neuroshell.com
BACK TO LIST

AMIBROKER: DECEMBER 2013 TRADERS’ TIPS CODE
In “Swing Trading With Three Indicators” in this issue, author Donald Pendergast presents a simple system based on three moving averages. Ready-to-use code for the indicators is presented here. To display the indicators, paste them into the AmiBroker formula editor and press apply indicator. To backtest a trading system, choose backtest from the Tools menu in the formula editor.
LISTING 1.
Plot( C, "Price", colorBlack, styleBar | styleThick );

MAH = MA( High, 5 );
MAL = MA( Low, 5 );

MAE = EMA( Close, 50 );

Plot( MAH, "MA of highs", colorGold, styleThick );
Plot( MAL, "MA of lows", colorRed, styleThick );
Plot( MAE, "EMA of close", colorBlue, styleThick );

Buy = Cross( Close, MAH + 0.05 ) AND Ref( Close > MAE, -1 );

TrailingStop = MAL;
SellPrice = TrailingStop;
Sell = Low < TrailingStop;

Buy = ExRem( Buy, Sell );
Sell = ExRem( Sell, Buy );

PlotShapes( Buy * shapeUpArrow, colorGreen, 0, Low );
PlotShapes( Sell * shapeDownArrow, colorRed, 0, High );
A sample chart is shown in Figure 6.
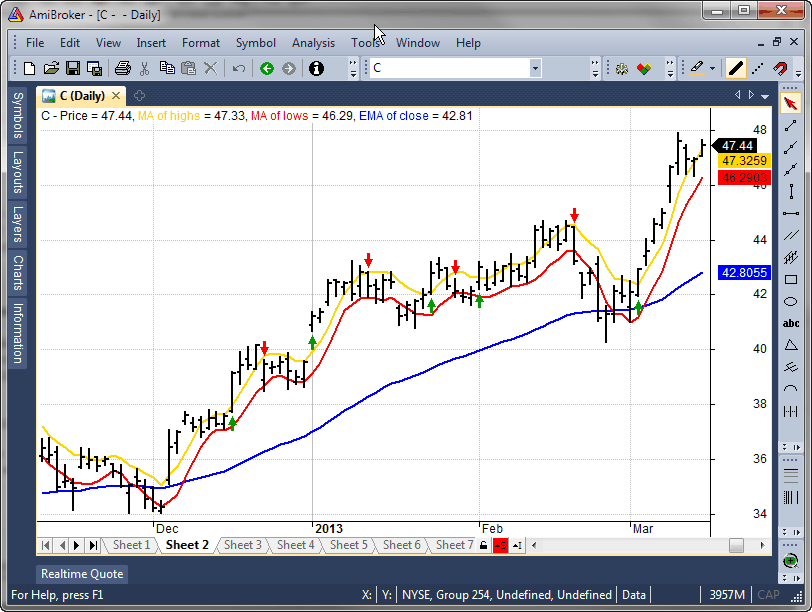
FIGURE 6: AMIBROKER. Here is a sample price chart of Citigroup with three moving averages and buy/sell arrows generated by the code.
—Tomasz Janeczko, AmiBroker.com
www.amibroker.com
BACK TO LIST

AIQ: DECEMBER 2013 TRADERS’ TIPS CODE
The AIQ code based on Donald Pendergast’s article in this issue, “Swing Trading With Three Indicators,” is provided at the following website: www.TradersEdgeSystems.com/traderstips.htm.
In addition to coding the author’s system as described in his article — which uses the following rules: buy to enter long and sell to exit the longs; short to enter shorts and cover to exit shorts — I created a second system that uses average true range to get the breakout amount. I also added some additional trend filters that use the NASDAQ 100 index. All trading was simulated using closing prices to determine whether an entry/exit had occurred, and then the trades are entered/exited the next day at the open. My modified system uses rules to “BuyATR,” “SellATR,” “ShortATR,” and “CoverATR.” A comparison of equity curves is shown in Figure 7. In testing the short side, neither the author’s original system nor my modified system was able to produce profitable results, although my modified system has a smaller total loss than the author’s original system.
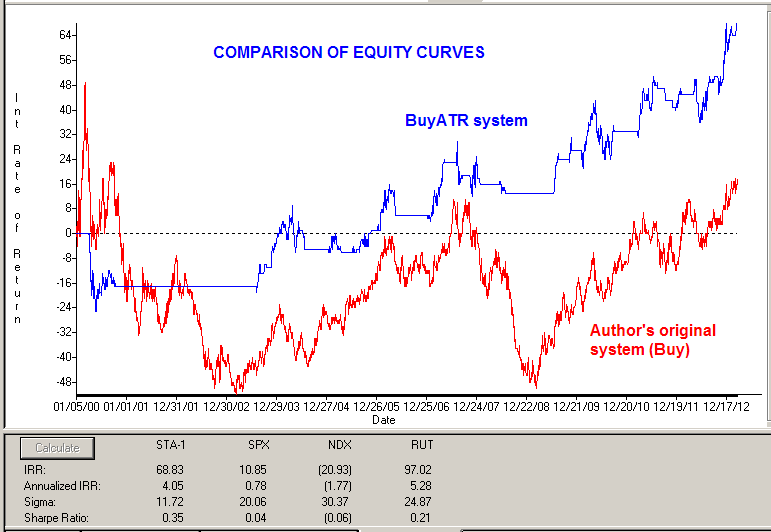
FIGURE 7: AIQ, EQUITY CURVE. Here is a comparison of the equity curves for Donald Pendergast’s original system and my modified system trading the NASDAQ 100 list of stocks for the period 1/5/2000 to 10/9/2013.
The code and EDS file can be downloaded from www.TradersEdgeSystems.com/traderstips.htm.
!SWING TRADING WITH THREE INDICATORS

!Author: Donald Pendergast, TASC December 2013

!Coded by: Richard Denning 10/10/2013

!www.TradersEdgeSystems.com


!INPUTS:

emaLen is 50.

smaLen is 5.

breakAmt is 0.05.

atrLen is 10.

atrMult is 0.04.

H is [high].

L is [low].

C is [close].

C1 is valresult(C,1).

price is C.

emaLenLT is 200.


!UDFs:

maH is simpleavg(H,smaLen).

maL is simpleavg(L,smaLen).

ema is expavg(C,emaLen).

emaLT is expavg(C,emaLenLT).

TR is Max(H - L,max(abs(C1 - L),abs(C1- H))).

ATR is simpleavg(TR,atrLen).

ATRpct is simpleavg(TR/C,atrLen).

ndxC is tickerUDF("NDX",C).

emaNDX is tickerUDF("NDX",ema).

emaNDXlt is tickerUDF("NDX",emaLT).


!SYSTEM RULES:

!Author's system:

Buy if price > maH+breakAmt and C > ema.

Sell if price < maL.

Short if price < maL-breakAmt and C < ema.

Cover if price > maH.


!Modified system using average true range:

BuyATR if price > maH+atrMult*ATR and C > ema and ndxC < emaNDX and ndxC > emaNDXlt .

SellATR if price < maL-atrMult*ATR.

ShortATR if price < maL-atrMult*ATR and C < ema and ndxC > emaNDX.

CoverATR if price > maH+atrMult*ATR.
—Richard Denning
info@TradersEdgeSystems.com
for AIQ Systems
BACK TO LIST

TRADERSSTUDIO: DECEMBER 2013 TRADERS’ TIPS CODE
The TradersStudio code based on Donald Pendergast’s article in this issue, “Swing Trading With Three Indicators,” is provided at the following websites:
The following code file is contained in the download:
System: SWING_SYS1
I set up a trading simulation using the S&P 500 futures contract (SP) using data from Pinnacle Data. I optimized the emaLen parameter, which is used for the EMA trend filter and the smaLen parameter, which is used for the average length of the high & lows. The breakout amount was set and held at zero.
A three-dimensional graph of these two parameters is shown in Figure 8. The short side pulled the results down, and we see that most of the parameter sets have a negative profit. In the code file, I have commented out the short-side rules for this reason. The best parameter set for trading long is emaLen=250, smaLen=20, breakAmt=0.
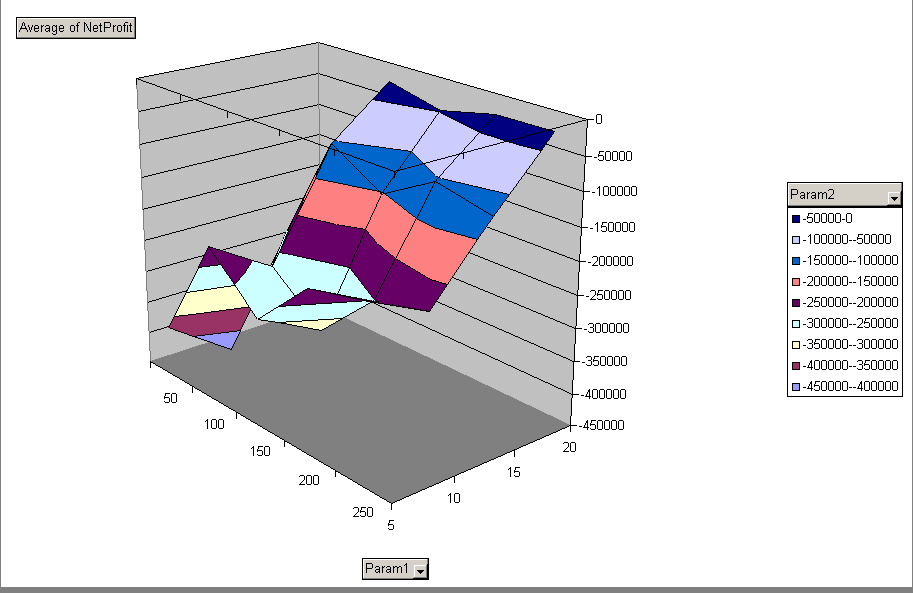
FIGURE 8: TRADERSSTUDIO. Here is a three-dimensional optimization graph for the period 1982–2013 trading the S&P futures contract.
The code is shown here:
'SWING TRADING WITH THREE INDICATORS

'Author: Donald Pendergast, TASC December 2013

'Coded by: Richard Denning 10/10/2013

'www.TradersEdgeSystems.com


Sub SWING_SYS1(emaLen,smaLen,breakAmt)

Dim price As BarArray

Dim maH As BarArray

Dim maL As BarArray

Dim ema As BarArray

price = C

maH = Average(H,smaLen)

maL = Average(L,smaLen)

ema = XAverage(C,emaLen)

If price > maH+breakAmt And price > ema Then Buy("LE",1,0,Market,Day)

If price < maL Then ExitLong("LX","",1,0,Market,Day)

'If price < maL-breakAmt And price < ema Then Sell("SE",1,0,Market,Day)

'If price > maH Then ExitShort("SX","",1,0,Market,Day)


End Sub
—Richard Denning
info@TradersEdgeSystems.com
for TradersStudio
BACK TO LIST

TC2000: DECEMBER 2013 TRADERS’ TIPS CODE
This Traders’ Tip is for TC2000 version 12.4, based on Donald Pendergast’s article in this issue, “Swing Trading With Three Indicators.”
You can combine TC2000.com’s charting, scanning, and alerting features to apply the swing trading method discussed in Pendergast’s article.
Figure 9 shows the results of a scan applied to the Russell 1000 components to find stocks where: 1) price exceeds the upper (gold) five-period moving average of the daily highs by five ticks (0.05), and 2) the price bar prior to the break of the upper moving average has closed above the (blue) 50-day exponential moving average of price. One of the stocks passing this scan is Dow Chemical (DOW).
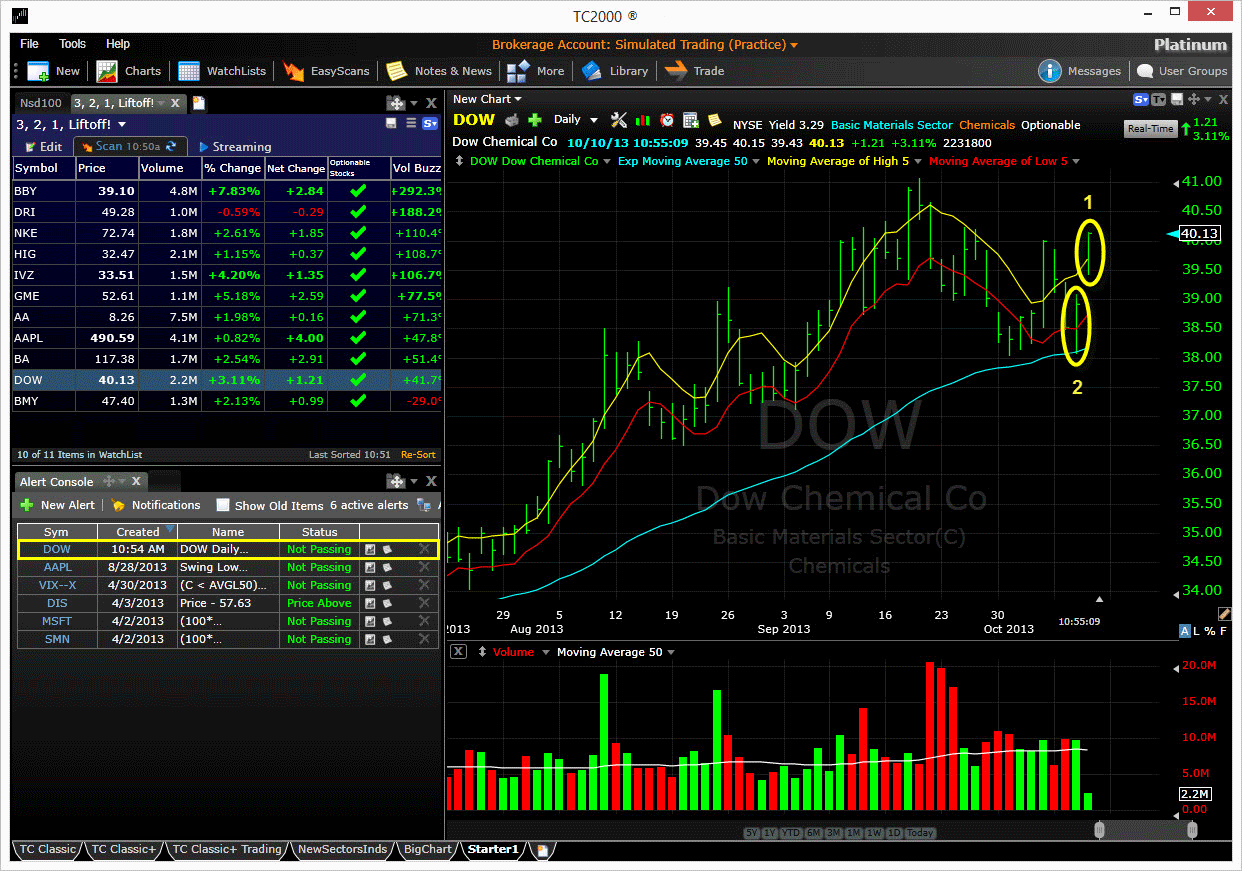
FIGURE 9: TC2000. A scan of the Russell 1000 using a scan based on Donald Pendergast’s described system returned 11 stocks. An alert has been set for Dow Chemical (DOW) to notify the user when price crosses down through the five-period moving average of the lows. The alert on DOW is outlined in the alert console in the lower left.
In the Vol buzz column in the watchlist, you can see that volume for DOW is trading 41% higher than its average volume at this time of day (11:08 am ET) and is up 3.11% at this point. Should you take a position, you can set an alert to notify you when the price dips below the five-period moving average of the daily lows. TC2000 servers monitor the alert rule and will notify you via email or text message when it fires; you don’t have to be at your computer to get the alert.
For a free trial of TC2000, visit www.TC2000.com/TryFree.
—Patrick Argo
Worden Brothers, Inc.
www.Worden.com
BACK TO LIST

NINJATRADER: DECEMBER 2013 TRADERS’ TIPS CODE
We have implemented the swing trading strategy described by Donald Pendergast in his article in this issue, “Swing Trading With Three Indicators,” as a NinjaTrader strategy named ThreeIndicatorTrading, available for download at www.ninjatrader.com/SC/December2013SC.zip.
Once it has been downloaded, from within the NinjaTrader Control Center window, select the menu File → Utilities → Import NinjaScript and select the downloaded file. This file is for NinjaTrader version 7 or greater.
You can review the strategy source code by selecting the menu Tools → Edit NinjaScript → Strategy from within the NinjaTrader Control Center window and selecting the “ThreeIndicatorTrading” file.
A sample chart implementing the strategy is shown in Figure 10.
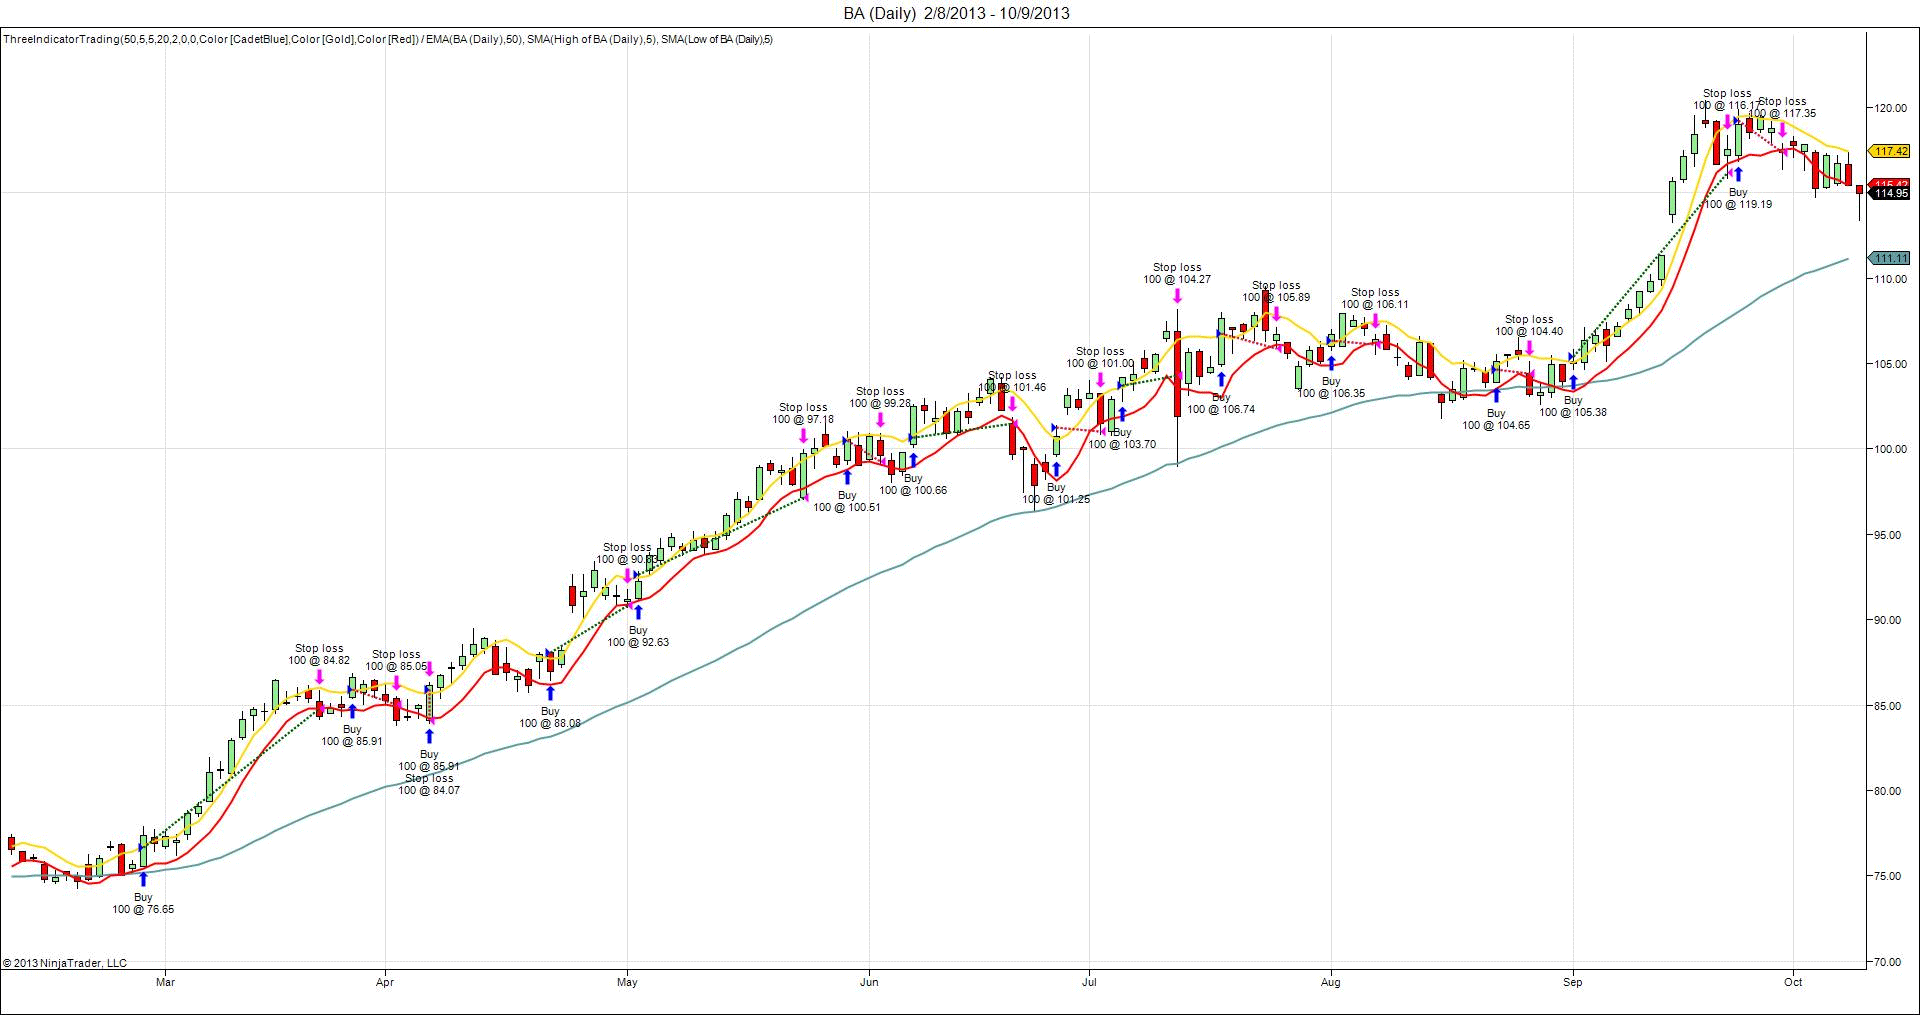
FIGURE 10: NINJATRADER. This screenshot shows the ThreeIndicatorTrading strategy applied to a daily chart of Boing (BA).
—Raymond Deux & Lance Britton
NinjaTrader, LLC
www.ninjatrader.com
BACK TO LIST

UPDATA: DECEMBER 2013 TRADERS’ TIPS CODE
This Traders’ Tip is based on “Swing Trading With Three Indicators” by Donald Pendergast in this issue.
The three indicators discussed in the article are a long-term exponential moving average of close prices, and simple moving averages of high and low prices. Some threshold levels are added to the upper average of the high prices, and when the close is above this level while above the long-term average, long trades are initiated. Positions are closed when the price closes below the average of the lows. The converse is true for short entries and cover exits.
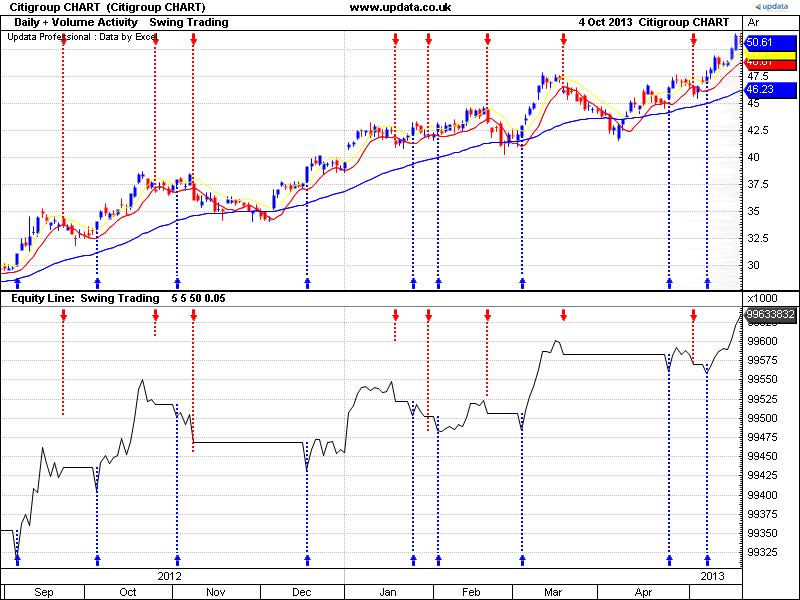
FIGURE 11: UPDATA. This chart shows Donald Pendergast’s swing trading strategy as applied to Citigroup daily share price. The equity generated by the system is shown in the bottom pane.
The Updata code for this strategy has been added to the Updata library and may be downloaded by clicking the custom menu and system library. Those who cannot access the library due to a firewall may paste the code shown below into the Updata custom editor and save it.
PARAMETER "High Avg. Period" #hiPERIOD=5
PARAMETER "Low Avg. Period" #loPERIOD=5
PARAMETER "Exp.Avg. Period" #expPERIOD=50
PARAMETER "Theshold" @THRESHOLD=0.05
DISPLAYSTYLE 3LINES
INDICATORTYPE TOOL
COLOUR RGB(255,255,0)
COLOUR2 RGB(255,0,0)
COLOUR3 RGB(0,0,255)
NAME "Swing Trading" ""
@HIGHAVG=0
@LOWAVG=0
@EXPAVG=0
FOR #CURDATE=0 TO #LASTDATE
   'VARIABLES
   @HIGHAVG=SGNL(HIGH(1),#hiPERIOD,M)
   @LOWAVG=SGNL(LOW(1),#hiPERIOD,M)
   @EXPAVG=SGNL(CLOSE,#expPERIOD,E)
   'LONG EXIT
   IF ORDERISOPEN=1 AND CLOSE<@LOWAVG
      SELL CLOSE
   ENDIF
   'LONG ENTRY
   IF HIST(CLOSE>@EXPAVG,1) AND HASX(CLOSE,@HIGHAVG+@THRESHOLD,UP)
      BUY CLOSE
   ENDIF
   'SHORT EXIT
   IF ORDERISOPEN=-1 AND CLOSE>@HIGHAVG
      COVER CLOSE
   ENDIF
   'SHORT ENTRY
   IF HIST(CLOSE<@EXPAVG,1) AND HASX(CLOSE,@LOWAVG-@THRESHOLD,DOWN)
      SHORT CLOSE
   ENDIF
   'PLOT LINES
   @PLOT=@HIGHAVG
   @PLOT2=@LOWAVG
   @PLOT3=@EXPAVG
NEXT
—Updata support team
support@updata.co.uk
www.updata.co.uk
BACK TO LIST

SHARESCOPE: DECEMBER 2013 TRADERS’ TIPS CODE
The ShareScope script offered this month is based on Donald Pendergast’s article in this issue, “Swing Trading With Three Indicators.” The code is shown in below, and can also be downloaded here.
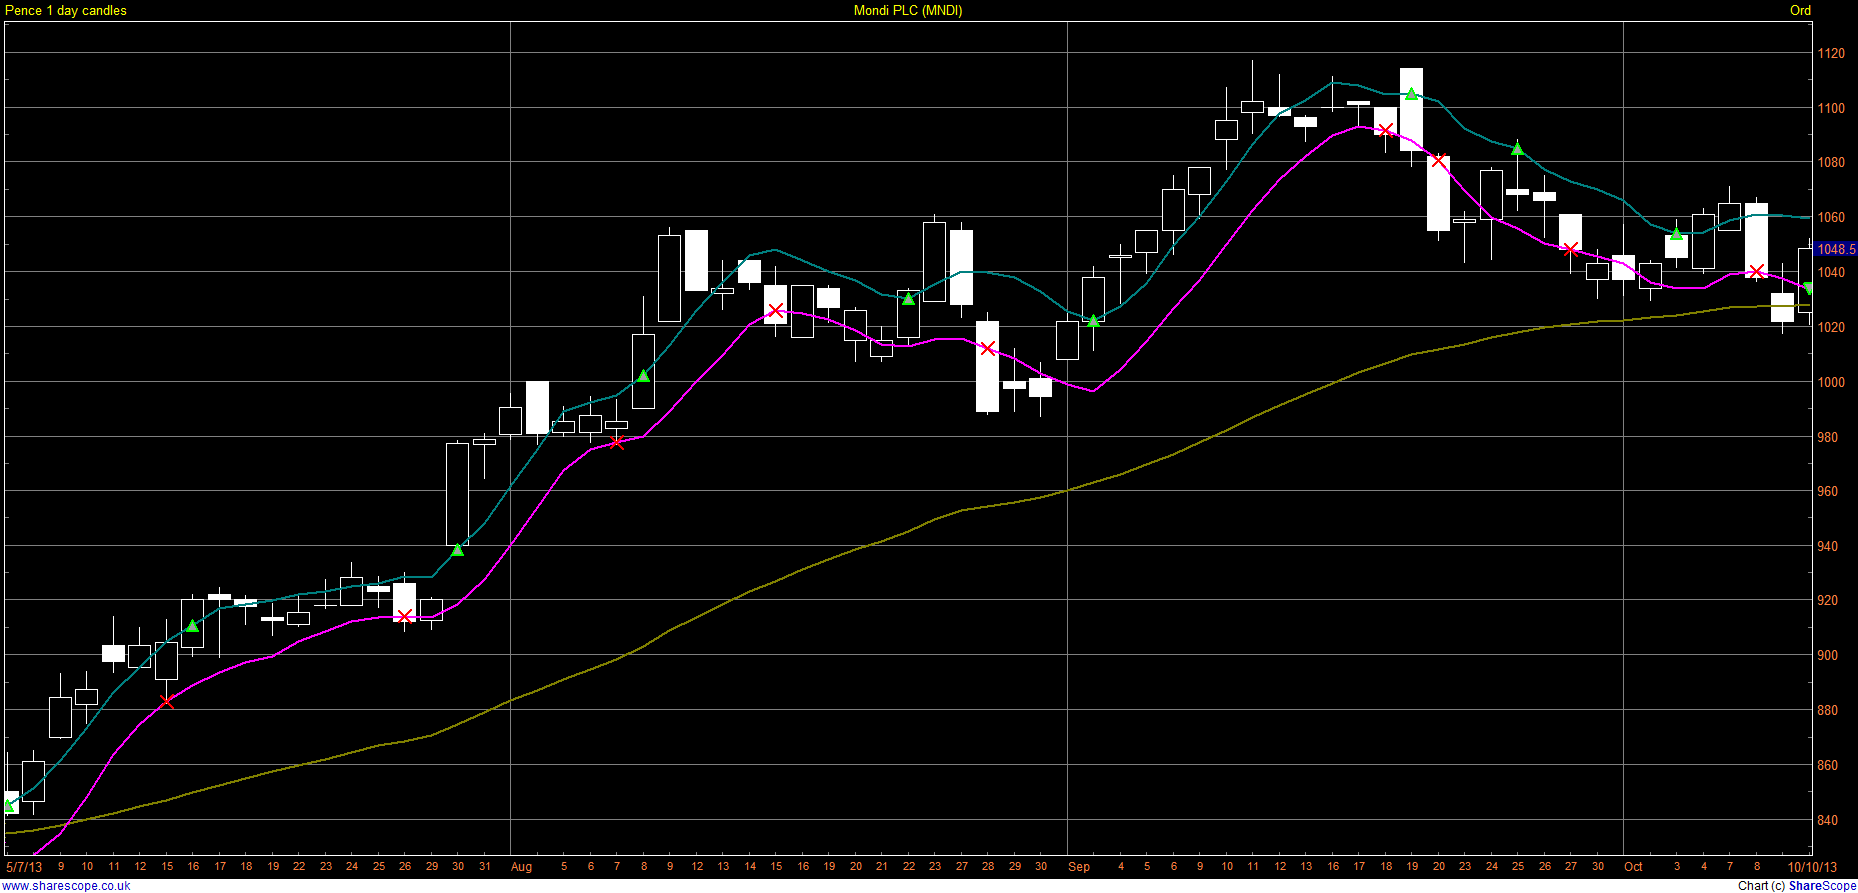
FIGURE 12: SHARESCOPE. Here’s an example of Don Pendergast’s swing trading strategy implemented in ShareScope.
//@Name:3 Indicator Swing

//@Description:Three indicator swing trading system. As described on Stocks & Commodities, December 2013.

//@Env:Production


// Care has been taken in preparing this code but it is provided without guarantee.

// You are welcome to modify and extend it.  Please add your name as a modifier if you distribute it.


//Coded by: Richard Chiesa, ShareScript Support


var posCol = Colour.RGB(0,220,0);

var negCol = Colour.Red;

var keltnerCol = Colour.RGB(0,178,178);


function onNewChart()

{

	draw();

}


function draw()

{

	clearDisplay();

	var ma1 = new MA(50, MA.Exponential);

	var ma2 = new MA(5);

	var ma3 = new MA(5);

	var EMA = [];

	var SMAH = [];

	var SMAL = [];

	for (var i=0;i<bars.length;i++)

	{

		EMA[i] = ma1.getNext(bars[i].close);

		SMAH[i] = ma2.getNext(bars[i].high)

		SMAL[i] = ma3.getNext(bars[i].low)

	}

	setPenStyle(0,1,Colour.DarkYellow);

	moveTo(0,bars[0].close);

	for (var i=1;i<bars.length;i++) lineTo(i,EMA[i]);

	setPenStyle(0,1,Colour.DarkCyan);

	moveTo(0,bars[0].close);

	for (var i=1;i<bars.length;i++) lineTo(i,SMAH[i]);

	setPenStyle(0,1,Colour.Magenta);

	moveTo(0,bars[0].close);

	for (var i=1;i<bars.length;i++) lineTo(i,SMAL[i]);

	var posOpen = 0;

	for (var i=1;i<bars.length;i++)

	{

		if (posOpen==0 && bars[i].high>SMAH[i] && bars[i-1].close>EMA[i-1])

		{

			posOpen=1;

			setPenStyle(0,1,Colour.Green);

			drawSymbol(i,SMAH[i],Symbol.TriangleUp,"",BoxAlign.Centre|BoxAlign.VCentre,12,true);

			continue;

		}

		if (posOpen==0 && bars[i].low<SMAL[i] && bars[i-1].close<EMA[i-1])

		{

			posOpen=-1;

			setPenStyle(0,1,Colour.Green);

			drawSymbol(i,SMAL[i],Symbol.TriangleDown,"",BoxAlign.Centre|BoxAlign.VCentre,12,true);

			continue;

		}

		if (posOpen==1 && bars[i].low<SMAL[i])

		{

			posOpen=0;

			setPenStyle(0,1,Colour.Red);

			drawSymbol(i,SMAL[i],Symbol.Cross,"",BoxAlign.Centre|BoxAlign.VCentre,12,true);

			continue;

		}

		if (posOpen==-1 && bars[i].high>SMAH[i])

		{

			posOpen=0;

			setPenStyle(0,1,Colour.Red);

			drawSymbol(i,SMAH[i],Symbol.Cross,"",BoxAlign.Centre|BoxAlign.VCentre,12,true);

			continue;

		}

	}

}
—Tim Clarke
ShareScope
www.sharescript.co.uk
BACK TO LIST

TRADING BLOX: DECEMBER 2013 TRADERS’ TIPS CODE
In “Swing Trading With Three Indicators” in this issue, author Donald Pendergast presents a simple swing trading system using three moving averages to capture swings in the direction of the trend. The system enters long when yesterday’s close is above the 50-day exponential moving average and the price breaks above the five-day simple moving average of the daily highs. The five-day simple moving average of the lows is used as a trailing stop.
We created three moving average indicators with corresponding parameters for number of bars:
Entry rules:
Exit rules:
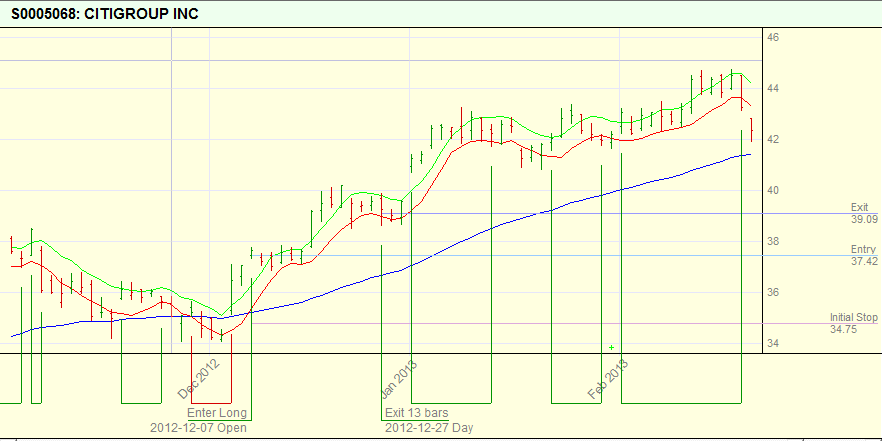
FIGURE 13: TRADING BLOX, Example trade. We tested the strategy on Citigroup from January 2012 to the end of September 2013 risking 1% per trade.
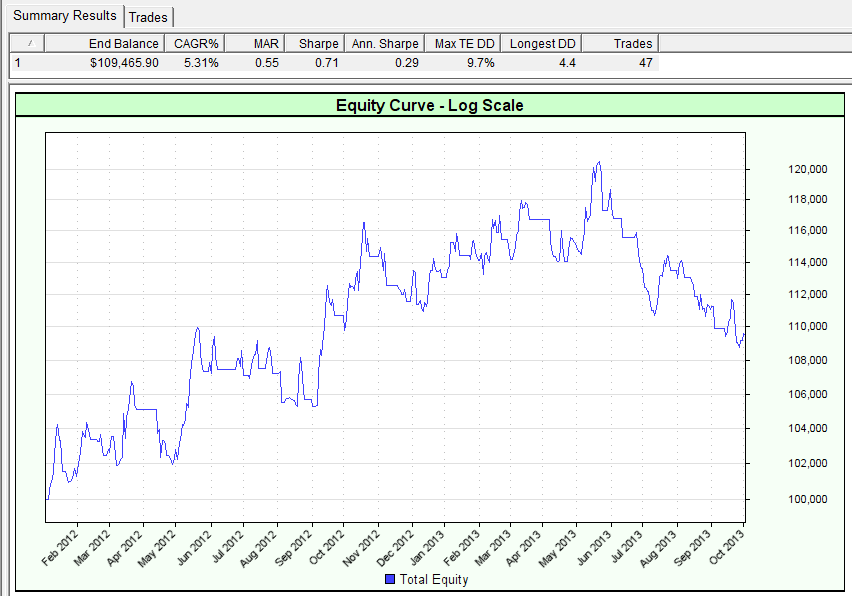
EXAMPLE 14: TRADING BLOX, Summary Results. This shows the resulting equity curve.
—Trading Blox
tradingblox.com
BACK TO LIST

VT TRADER: DECEMBER 2013 TRADERS’ TIPS CODE
This Traders’ Tip is based on “Swing Trading With Three Indicators” in this issue by Donald Pendergast. In the article, Pendergast describes a simple momentum/breakout trading strategy that utilizes two five-period moving averages of the high/low prices, respectively, to form a channel, and a 50-period moving average to determine the trend direction.
We’ll be offering our version of the Pendergast’s swing trading system for download in our VT client forums at https://forum.vtsystems.com along with other precoded and free trading systems. The VT Trader instructions for creating the aforementioned trading system are as follows:
- Ribbon→Technical Analysis menu→Trading Systems group→Trading Systems Builder command→[New] button
- In the General tab, type the following text for each field:
Name: TASC - 12/2013 - Swing Trading with Three Indicators
Function Name Alias: tasc_SwingTrd3IndSys
Label Mask: TASC - December 2013 - Swing Trading w/ 3 Indicators
- In the Input Variable(s) tab, create the following variables:
[New] button...
Name: pr1
Display Name: Upper Channel MA Price
Type: price
Default: high

[New] button...
Name: tp1
Display Name: Upper Channel MA Periods
Type: integer
Default: 5

[New] button...
Name: mTp1
Display Name: Upper Channel MA Type
Type: MA Type
Default: Simple

[New] button...
Name: pr2
Display Name: Lower Channel MA Price
Type: price
Default: low

[New] button...
Name: tp2
Display Name: Lower Channel MA Periods
Type: integer
Default: 5

[New] button...
Name: mTp2
Display Name: Lower Channel MA Type
Type: MA Type
Default: Simple

[New] button...
Name: pr3
Display Name: Trend MA Price
Type: price
Default: close

[New] button...
Name: tp3
Display Name: Trend MA Periods
Type: integer
Default: 50

[New] button...
Name: mTp3
Display Name: Trend MA Type
Type: MA Type
Default: Exponential

[New] button...
Name: CB
Display Name: Channel Buffer for Entry (in Pips)
Type: float
Default: 0
- In the Output Variable(s) tab, create the following variables:
[New] button...
Var Name: UCMA
Name: Upper Channel MA
* Checkmark: Indicator Output
Select Indicator Output Tab
Line Color: gold
Line Width: 1
Ling Style: solid
Placement: Price Frame
[OK] button...

[New] button...
Var Name: LCMA
Name: Lower Channel MA
* Checkmark: Indicator Output
Select Indicator Output Tab
Line Color: red
Line Width: 1
Ling Style: solid
Placement: Price Frame
[OK] button...

[New] button...
Var Name: TRNDMA
Name: Trend MA
* Checkmark: Indicator Output
Select Indicator Output Tab
Line Color: blue
Line Width: 1
Ling Style: solid
Placement: Price Frame
 [OK] button...

[New] button...
Var Name: LongEntrySignal
Name: Long Entry Signal
* Checkmark: Graphic Enabled
* Checkmark: Alerts Enabled
Select Graphic Tab
Font […]: Up Arrow
Size: Medium
Color: Blue
Symbol Position: Below price plot
	Select Alerts Tab
		Alert Message: Long Entry Signal
		Alert Sound: others.wav
[OK] button...

[New] button...
Var Name: LongExitSignal
Name: Long Exit Signal
* Checkmark: Graphic Enabled
* Checkmark: Alerts Enabled
Select Graphic Tab
Font […]: Exit Sign
Size: Medium
Color: Blue
Symbol Position: Above price plot
	Select Alerts Tab
		Alert Message: Long Exit Signal
		Alert Sound: others.wav
[OK] button...

[New] button...
Var Name: ShortEntrySignal
Name: Short Entry Signal
* Checkmark: Graphic Enabled
* Checkmark: Alerts Enabled
Select Graphic Tab
Font […]: Down Arrow
Size: Medium
Color: Red
Symbol Position: Above price plot
	Select Alerts Tab
		Alert Message: Short Entry Signal
		Alert Sound: others.wav
[OK] button...

[New] button...
Var Name: ShortExitSignal
Name: Short Exit Signal
* Checkmark: Graphic Enabled
* Checkmark: Alerts Enabled
Select Graphic Tab
Font […]: Exit Sign
Size: Medium
Color: Red
Symbol Position: Below price plot
	Select Alerts Tab
		Alert Message: Short Exit Signal
		Alert Sound: others.wav
[OK] button...

[New] button...
Var Name: OpenBuy
Name: Open Buy
* Checkmark: Trading Enabled
Select Trading Tab
Trading Action: BUY
[OK] button...

[New] button...
Var Name: CloseBuy
Name: Close Buy
* Checkmark: Trading Enabled
Select Trading Tab
Trading Action: SELL
[OK] button...

[New] button...
Var Name: OpenSell
Name: Open Sell
* Checkmark: Trading Enabled
Select Trading Tab
Trading Action: SELL
[OK] button...

[New] button...
Var Name: CloseSell
Name: Close Sell
* Checkmark: Trading Enabled
Select Trading Tab
Trading Action: BUY
[OK] button...
- In the Formula tab, copy and paste the following formula:
{Provided By: Visual Trading Systems, LLC}
{Copyright: 2013}
{Description: TASC, December 2013 - "Swing Trading with Three Indicators" by Donald Pendergast}
{File: tasc_SwingTrd3IndSys.vttrs - Version 1.0}

{Moving Averages}

UCMA:= mov(pr1,tp1,mTp1);
LCMA:= mov(pr2,tp2,mTp2);
TRNDMA:= mov(pr3,tp3,mTp3);

{Basic Trade Entry/Exit Criteria}

LongEntrySetup:= C>TRNDMA AND Cross(C,(UCMA+CB));
LongExitSetup:= Cross(LCMA,C);

ShortEntrySetup:= C<TRNDMA AND Cross((LCMA-CB),C);
ShortExitSetup:= Cross(C,UCMA);

{Long Entry Signal}

LongEntrySignal:= (LongTradeAlert=0 AND ShortTradeAlert=0 AND LongEntrySetup=1) OR
                  (LongTradeAlert=0 AND ShortExitSetup=1 AND LongEntrySetup=1);

{Long Exit Signal}

LongExitSignal:= LongTradeAlert=1 AND LongExitSetup=1;

{Short Entry Signal}

ShortEntrySignal:= (ShortTradeAlert=0 AND LongTradeAlert=0 AND ShortEntrySetup=1) OR
                   (ShortTradeAlert=0 AND LongExitSetup=1 AND ShortEntrySetup=1);

{Short Exit Signal}

ShortExitSignal:= ShortTradeAlert=1 AND ShortExitSetup=1;

{Open Trade Determination for Long/Short EntryExit Signals}

LongTradeAlert:= SignalFlag(LongEntrySignal,LongExitSignal);
ShortTradeAlert:= SignalFlag(ShortEntrySignal,ShortExitSignal);

{Create Auto-Trading Functionality; Only used in Auto-Trade Mode}

OpenBuy:= BuyPositionCount()=0 AND LongEntrySignal=1;
CloseBuy:= BuyPositionCount()>0 AND LongExitSignal=1;

OpenSell:= SellPositionCount()=0 AND ShortEntrySignal=1;
CloseSell:= SellPositionCount()>0 AND ShortExitSignal=1;
- Click the “Save” icon to finish building the trading system.
To attach the trading system to a chart, select the “Add trading system” option from the chart’s contextual menu, select “TASC - 12/2013 - Swing Trading with Three Indicators” from the trading systems list, and click the add button.
A sample chart is shown in Figure 15.
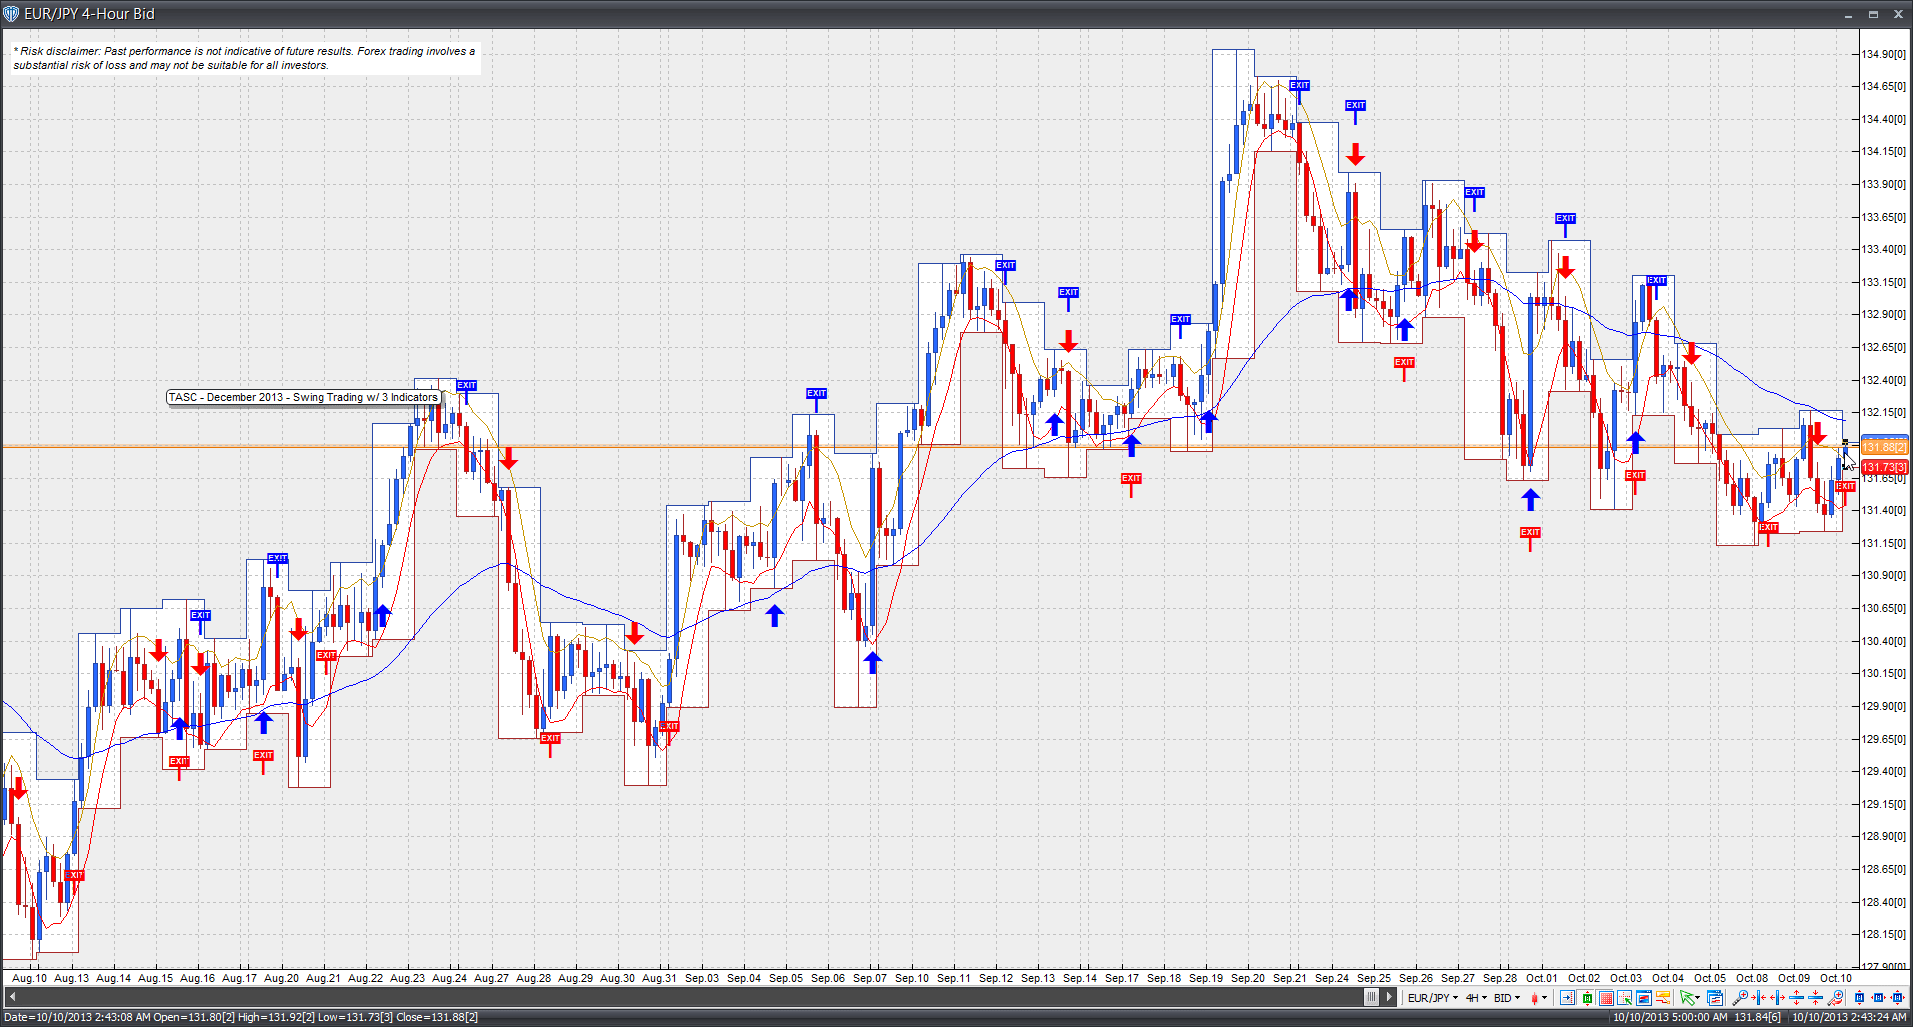
FIGURE 15: VT TRADER. Here, Donald Pendergast’s described trading strategy is plotted on a EUR/JPY four-hour candlestick chart.
Risk disclaimer: Past performance is not indicative of future results. Forex trading involves a substantial risk of loss and may not be suitable for all investors.
—Chris Skidmore
Visual Trading Systems, LLC
vttrader@vtsystems.com, www.vtsystems.com
BACK TO LIST
MICROSOFT EXCEL: DECEMBER 2013 TRADERS’ TIPS CODE
In “Swing Trading With Three Indicators” in this issue, author Donald Pendergast provides a nice outline of how one might go about designing a simple trading system.
The basic computations for this strategy are straightforward. The trading rules that Pendergast describes limit long trades to periods of uptrends and short trades to periods of downtrends, with the trend direction determined by the relationship of prices to the 50-day moving average of the close. This rule means that this system doesn’t start out trying to fight the market. It also means that we won’t see long & short trades interspersed using this system.
Trade entry & exit prices are set by the relationship of the bar’s open to the five-bar EMA reference that opens or exits the trade. A sample chart implementing the strategy is shown in Figure 16.
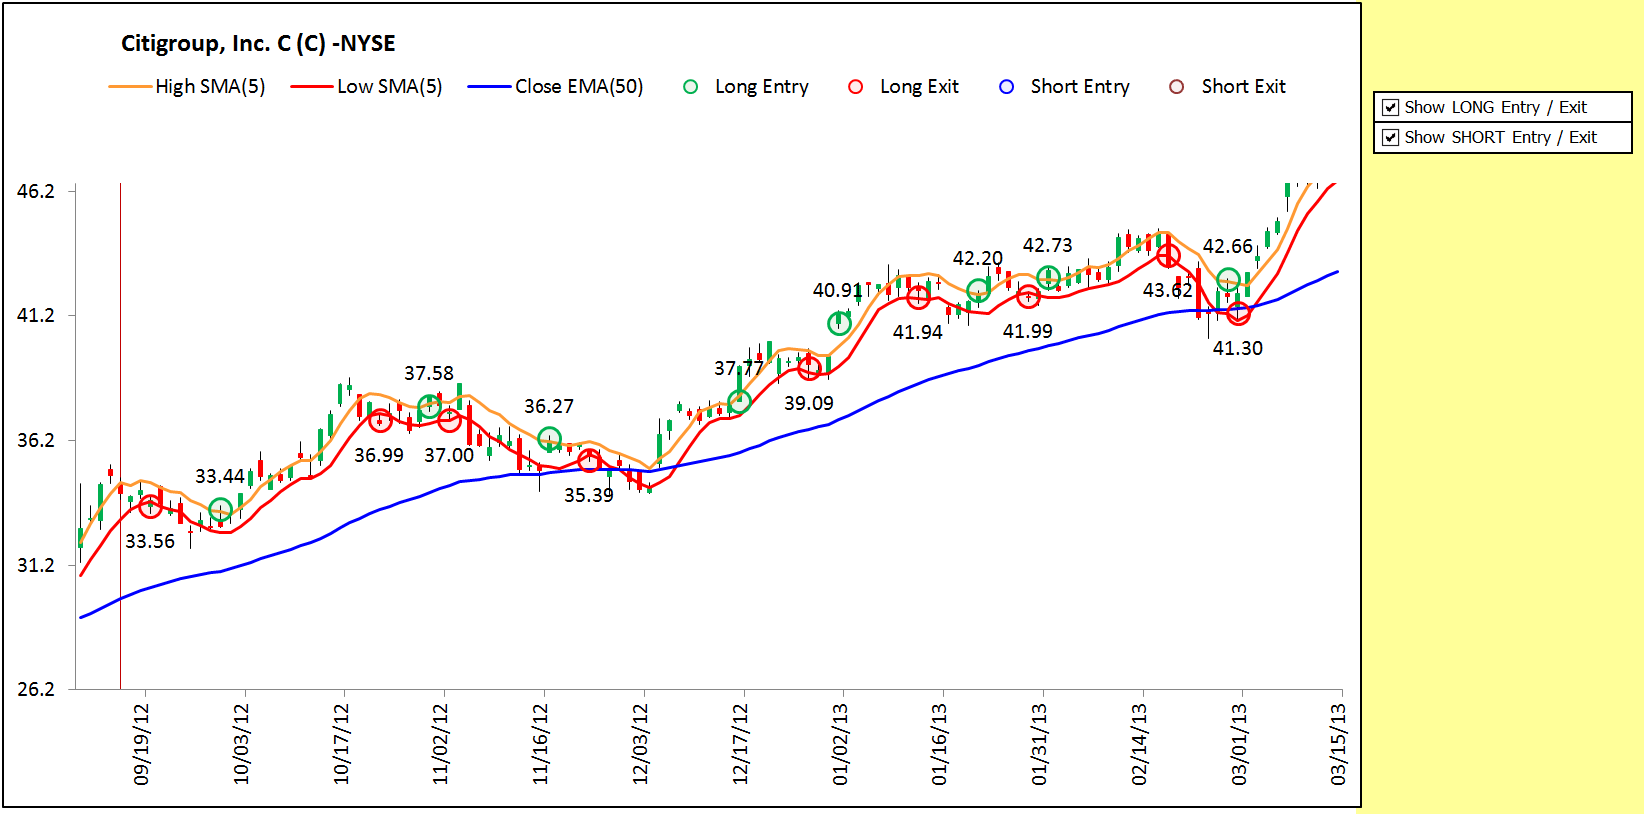
FIGURE 16: EXCEL, SWING TRADING STRATEGY. This sample chart of Citigroup shows the long entries & exits.
To track trades generated by this system, I have added a new “Transaction summary” tab to the Traders’ Tips Excel template (Figure 17). Like with the CalculationsAndCharts tab, the data here is listed in date-descending sequence, that is, the most recent trades are at the top of the list.
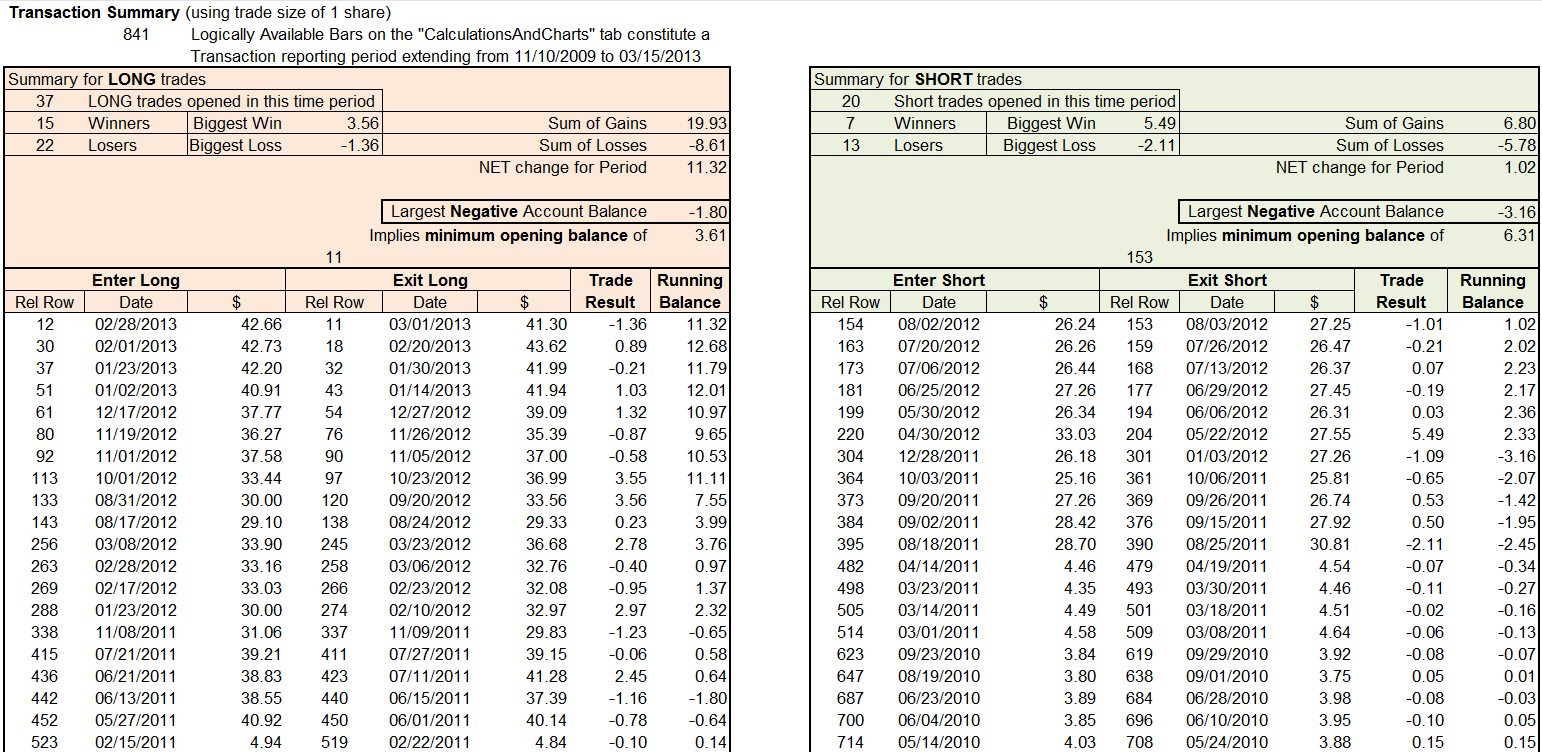
FIGURE 17: EXCEL, TRANSACTION SUMMARY. The transaction summary tab shows the trades generated. The data is listed in date-descending sequence, so that the most recent trades are at the top. If the most recent trade is still open, the summary will show that it’s open and that the trade has been marked to the current-bar closing price.
If the most recent trade is still open, the summary will show that it’s open and that the trade has been marked to the current-bar closing price.
The spreadsheet file for this Traders’ Tip can be downloaded from www.traders.com in the Traders’ Tips area. To successfully download it, follow these steps:
- Right-click on the Excel file link, then
- Select “save as” to place a copy of the spreadsheet file on your hard drive.
—Ron McAllister
Excel and VBA programmer
rpmac_xltt@sprynet.com
BACK TO LIST
Originally published in the December 2013 issue of
Technical Analysis of Stocks & Commodities magazine.
All rights reserved. © Copyright 2013, Technical Analysis, Inc.
Return to
Contents


