Exploring Charting Techniques: Creating A Trading Strategy,
Part 3
by Sylvain Vervoort
Three sidebars for the article “Exploring Charting Techniques: Creating A Trading Strategy, Part 3” by Sylvain Vervoort, in the September 2014 issue of Technical Analysis of Stocks & Commodities magazine.
- SVEhaClose Average Heikin-Ashi Close Indicator
- SVEBloodHoundSt1 Strategy
- Backtesting Results
1. SVEhaClose Average Heikin-Ashi Close Indicator
// SVEhaClose Average heikin-ashi close indicator

// SVEhaClose Sylvain Vervoort   https://stocata.org
// Release V1.0 July, 2012.

#region Using declarations
using System;
using System.ComponentModel;
using System.Diagnostics;
using System.Drawing;
using System.Drawing.Drawing2D;
using System.Xml.Serialization;
using NinjaTrader.Data;
using NinjaTrader.Gui.Chart;
#endregion

// This namespace holds all indicators and is required. Do not change it.
namespace NinjaTrader.Indicator
{
/// <summary>
/// The average heikin-ashi closing price.
/// </summary>
[Description("Heikin-ashi average close")]
public class SVEhaClose : Indicator
{
    #region Variables
    #endregion

/// <summary>
/// Configuring the indicator called once before any bar data.
/// </summary>
protected override void Initialize()
    	{
	  Add(new Plot(Color.Transparent, PlotStyle.Line, "haOpen"));
       	  Add(new Plot(Color.Black, PlotStyle.Line, "haC"));

	  PaintPriceMarkers 	= false;
	  Overlay		= true;
   	}

    /// <summary>
    /// Called on each bar update event (incoming tick)
    /// </summary>
    protected override void OnBarUpdate()
    	{
	if (CurrentBar < 1) // minimum 2 bars required
	return;

// Create average heikin-ashi closing price
	haOpen.Set((((Open[1] + High[1] + Low[1] + Close[1]) / 4) + haOpen[1]) / 2);
	haC.Set(((Open[0] + High[0] + Low[0] + Close[0]) / 4 + haOpen[0] +
	Math.Max(High[0], haOpen[0]) + Math.Min(Low[0], haOpen[0])) / 4);
    	}

#region Properties
[Browsable(false)]
      	[XmlIgnore]
     	public DataSeries haOpen
      	{
            get { return Values[0]; }
      	}

      	[Browsable(false)]
      	[XmlIgnore]
     	public DataSeries haC
        {
            get { return Values[1]; }
        }

#endregion
}
}
RETURN TO TOP
2. SVEBloodHoundSt1 Strategy
//SVEBloodHoundSt1 strategy

// Example BloodHound strategy1 Version 1, April 2014
// September 2014 issue of Technical Analysis of Stocks & Commodities
// Sylvain Vervoort   https://stocata.org/

#region Using declarations
using System;
using System.ComponentModel;
using NinjaTrader.Cbi;
using NinjaTrader.Data;
using NinjaTrader.Indicator;
using System.Collections.Generic;
using System.Xml.Serialization;
#endregion

namespace NinjaTrader.Strategy
{
  public class SVEBloodHoundSt1 : SiBloodHoundStrategy
  {
#region Variables
private int	average		= 21; 	 // average to show on strategy result chart
	private int	qty		=  1;	 // The buy or sell quantity
	private bool	longonly	= false; // Trade long only or long and short
	#endregion

        #region Methods

   	protected override void Initialize()
       {
    	base.Initialize(); // this is necessary to initialize the BloodHound Template

	CalculateOnBarClose 	= true;
	ExitOnClose 		= false;
	TraceOrders 		= true;
	EntryHandling 		= EntryHandling.UniqueEntries;
	if (average != 0) 	Add(SMA(Input,average)); // add the used LT average
       }

 	protected override void OnStartUp()
       {
       		base.OnStartUp(); // this is necessary to startup the BloodHound Template
       }

        protected override void OnBarUpdate()
       {
        // If an open position exists we may have to close it
	if (Position.MarketPosition != MarketPosition.Flat)
	{
	if (Position.MarketPosition == MarketPosition.Long && (BloodHound.ShortSignals[0] ||
	(BloodHound.ShortSignals[0] == false && BloodHound.LongSignals[0] == false)))

	ExitLong(Position.Quantity);

	else if (Position.MarketPosition==MarketPosition.Short&&(BloodHound.LongSignals[0] ||
	(BloodHound.LongSignals[0] == false && BloodHound.ShortSignals[0] == false)))

	ExitShort(Position.Quantity);
			}

	// If there is no open long position we may have to open one
	if (Position.MarketPosition != MarketPosition.Long)
	{
		if (BloodHound.LongSignals[0]) EnterLong(qty);
	}
	// If there is no open short position we may have top open one
	if (Position.MarketPosition != MarketPosition.Short)
	{
	if (BloodHound.ShortSignals[0] && longonly == false) EnterShort(qty);
				}
        }
        #endregion

      #region Properties

    	[GridCategory("Trade Management")]
   	[Gui.Design.DisplayName("Show LT-average on chart")]
[Description("LT average to be added on the strategy chart, if not needed set to 0")]
        public int _average
        {
            get { return average; }
            set { average = Math.Max(0, value); }
        }
        [GridCategory("Trade Management")]
        [Gui.Design.DisplayName("Quantity")]
        [Description("The quantity or contracts to buy or sell")]
        public int _qty
        {
            get { return qty; }
            set { qty = Math.Max(1, value); }
        }

        [GridCategory("Trade Management")]
		[Gui.Design.DisplayName("Long Only?")]
        public bool _longonly
        {
            get { return longonly; }
            set { longonly = value; }
        }

        #endregion
    }
}
RETURN TO TOP
3. Backtesting Results
The backtest settings are shown in sidebar Figure 1. The strategy used is “SVEBloodHoundSt1” with the templates “SVESC” and “Basic entry/exit” for the logic.
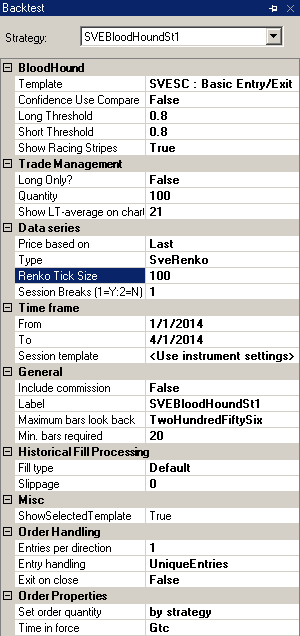
SIDEBAR FIGURE 1: STRATEGY BACKTEST SETTINGS. You select the key components of your backtest such as the strategy you want to test, the templates you use for the logic, whether you want to trade long or short, and the number of shares you wish to trade.
With “Long only?” you can choose to trade long only, or both long & short. “Quantity” is the number of stocks or amount you want to trade. “Show LT average on chart” allows you to repeat the long-term average used in the Solver setting, so that it is correctly displayed in the resulting chart of the backtest. Using zero will not display the long-term average.
This strategy will trade long or short when the indicator is 1 or -1, closing a long or short trade early when the indicator is zero. Or it will close the open trade and open an opposite one when the indicator switches direction.
I used a renko tick size of 100 (one point), trading 100 stocks and allowing for session breaks. I used tick data from January 1–April 1, 2014.
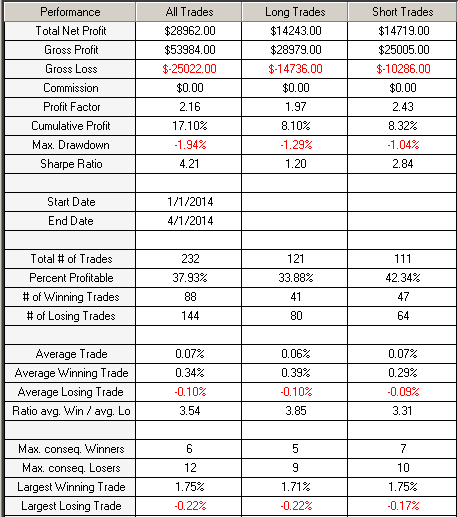
SIDEBAR FIGURE 2: BACKTEST RESULTS. The total profit from long and short trades is 17.1% and the maximum drawdown is 1.94%. The total number of trades is 232, with 88 winning and 144 losing trades. The largest winning trade gained 1.75% and the largest losing trade lost -0.22%.
In sidebar Figure 2 you see the test results over the selected three-month period. The total profit executing long and short trades is 17.1%. The maximum drawdown was 1.94%. There were a total of 232 trades, of which 88 were winning and 144 were losing trades. The largest winning trade was 1.75% and the largest losing trade was -0.22%. In sidebar Figure 3, you see the equity curve.
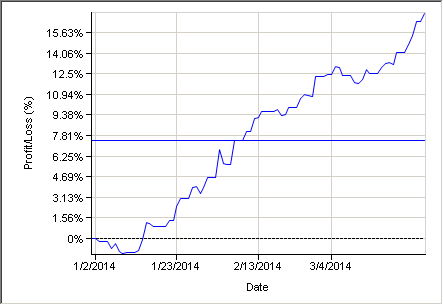
SIDEBAR FIGURE 3: EQUITY CURVE. A glance at the equity curve tells you that this is a profitable strategy.
Sidebar Figure 4 shows a couple of trading actions on the backtest chart. At the extreme left of the chart, the index is in a downtrend with an open short (red) position. The closing price of the first green candle on the green background is the trigger to close that short position (a buy-to-cover order) and to open a new long position (a buy-long order). Both orders are executed on the following candle at the opening price (blue up arrow).
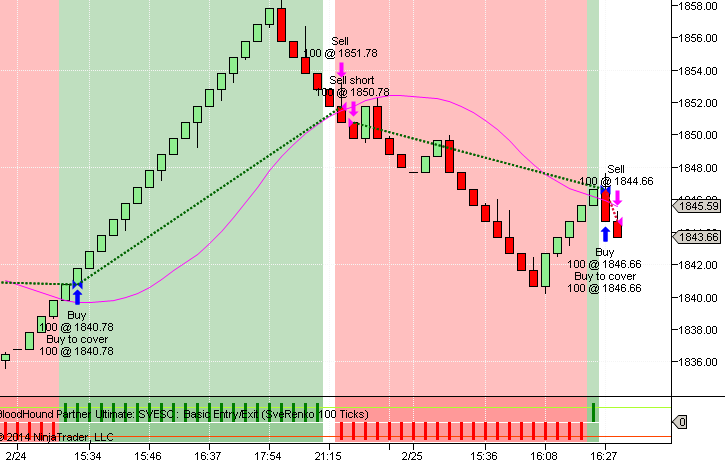
SIDEBAR FIGURE 4: BACKTESTING IN ACTION. Here you see a few of the trading sessions on the backtest chart.
This long position is closed with a profit triggered by the closing price of the red candle on the unshaded white background with a sell order that is executed at the open of the following candle (first magenta arrow down).
A new trigger signal appears at the close of this red candle in the red background. This sell short signal is executed at the open of the following bar (second magenta arrow down).
This short position is closed with a buy-to-cover order, triggered by the next green candle in the green background, at the open of the following candle. But this is also a new buy order. This new long order is triggered for a close in the following bar and executed at the open of the last bar on this chart. With this chart, you can verify that all elements of the strategy are complied with at the buy, sell, and close trade signals.
RETURN TO TOP