SYSTEM DESIGN
From Technical Terms To Technical Tools: Building studies based on psychological matrices
by Walter T. Downs
Here's how the psychological terms that technicians employ to describe the markets are transformed into technical tools.
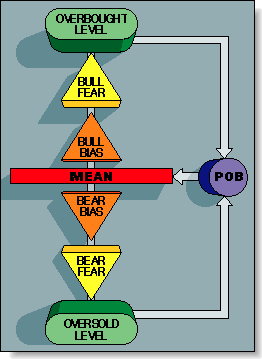
It is possible to transform psychology from a subjective interpretation into an objective tool. By creating a psychological matrix, we can define emotion so that you never think of fear and greed in quite the same way again. Accurate conceptualization and logical construction of the matrix allows a trader to develop a market edge. In addition, because the trader has a good understanding of each phase of the market as it unfolds, he or she is able to approach trading from a more reasoned perspective.
A market edge must be based on the accurate understanding of the difference between statistics and knowledge. Statistics represent numerical data assembled and classified so as to present significant information, while knowledge, for the purposes of the psychological matrix builder, is defined as the ownership of valuable information and the ability to correctly analyze and use it.
In this respect, statistics will serve as our milestones, and the observation of psychological traits of humans, combined with statistical measurement, will provide the knowledge we need to build a road map of the markets. By observing how people react to market stimuli, a trader gains knowledge to lead and define statistical action. Of key importance is that this is the difference between describing what has occurred on the left side of the chart and accurately assessing what may happen on the right.
ON THE RIGHT SIDE OF THE CHART
In accepting the psychological matrix builder's definition of knowledge, we can conclude that information without practical application is useless. A logical framework must be built to be able to consider and test our observations of how people deal with the markets.
Once we have a definition of what we are looking for and a hypothesis of how it relates to the markets, we can consider applications such as flow charts, systems and indicators. In this regard, statistics assume a key role. In our road map of the markets, such milestones will prove invaluable.

Excerpted from an article originally published in the August 1998 issue of Technical Analysis of STOCKS & COMMODITIES magazine. All rights reserved. © Copyright 1998, Technical Analysis, Inc.