NEW TECHNIQUES
Buy-And-Hold Comparisons To Evaluate Stock Trading
by Jack Schwager
Benchmark comparisons are a standard technique for the performance of a trading system. One particular benchmark is the buy-and-hold approach. This noted market analyst looks at the steps to using it.
Just because a trading system makes money in the stock market doesn't mean it's a good system. After all, it is possible for a system to do well but still fall short of the results that could have been realized by a simple buy-and-hold approach. The key question in testing a stock market system is: How does the system compare with the buy-and-hold approach?

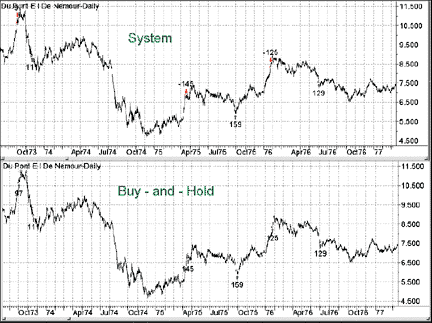
FIGURE 1: DUPONT DE NEMOURS & CO. Each time the constant share size system flashes a buy or sell signal, the new trade has a unique number of shares for the trade entered. Therefore, the buy-and-hold system must have the number of shares held adjusted to match the number of shares held by the the constant share system.THE PROBLEM
Answering this question is not as simple as it might appear. In my previous article, we showed why a constant share size trade assumption led to severe distortions in testing trading systems and why a constant dollar trade size assumption was far preferable. The problem, however, is that system results based on a constant dollar trade size -- for example, $1,000 -- cannot be directly compared with buy-and-hold results for the same number of shares as the first trade.
To understand why, assume a stock is trading at $5 at the start of the test period before it then advances to $50 by the end of the survey period. In this case, 200 shares, which equal $1,000 at the start, would equal $10,000 at the end. In contrast, the constant dollar trade size system results would continue to assume a $1,000 trade size on each signal.
As a result, the buy-and-hold case would assume a much larger average position size as time elapsed. Consequently, a comparison between the system results and buy-and-hold results would be that of the proverbial apples and oranges.
A TWO-STEP SOLUTION
Two possible adjustment methods can be used to allow valid comparisons between trading system results and buy-and-hold results.
Method 1 ¥ Adjust the constant share system trade size to reflect equity growth. This can be done by compounding the number of shares per trade using a factor based on the current equity. Multiply the ratio of $1,000/price by the ratio of current equity to the assumed starting equity. If the starting equity equals $1,000, then this factor ratio is equal to ($1,000 + net profit)/$1,000. Therefore, the number of shares is given by this formula:
Number of shares = ($1,000/price)($1,000 + Net profit)/$1,000
Thus, if the system made $2,000, the second factor in the equation would equal 3, because there would be $3,000 available instead of $1,000. This approach breaks down if the loss exceeds $1,000, since it would result in a negative equity ratio, which in turn would imply a negative number of shares -- a nonsensical result.
Next, we will need a percent return comparison with the buy-and-hold case, which should use a compounded percent return statistic. This is given by the following formula:
Compounded percent return = 100(Net profit/$1,000)
Jack Schwager is the author of the best-sellers Market Wizards and The New Market Wizards, as well as other works. His most recent is a 12-tape video course, Jack Schwager's Complete Guide To Designing And Testing Trading Systems, which was produced with Omega Research. Schwager is the CEO of Wizard Trading, a CTA firm that began managing client funds in 1990 and is currently associated with the Phoenix-based CTA Trendstat. His previous experience also includes 22 years as the director of futures research for some of Wall Street's leading firms.
Excerpted from an article originally published in the June 1999 issue of Technical Analysis of STOCKS & COMMODITIES magazine. All rights reserved. © Copyright 1999, Technical Analysis, Inc.
Return to June 1999 Contents