NOVICE TRADER
Momentum
by Stuart Evens
Trend-following methods and indicators have drawbacks: One, they indicate a change in trend after the fact, thereby missing a significant portion of the initial move. Two, markets spend a lot of time not in trends, but in trading ranges -- and using trend-following methods with prices in trading ranges can result in whipsaw losses. To avoid these pitfalls, momentum indicators are used to forewarn of a change in trend and the reversal of price at support and resistance levels within a trading range. Momentum is not a perfect method or indicator, but used appropriately, it can be extremely useful. A thorough understanding of momentum can help in making trading decisions.

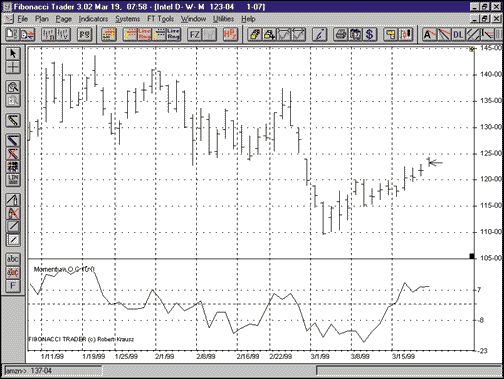
FIGURE 1: INTEL. The 10-day momentum line is plotted below the price bars for Intel. The indicator is calculated by subtracting the closing price 10 days ago, from the latest closing price.Because there is some confusion between the terms momentum and oscillator, a definition of oscillator is also in order. Murphy defines it as: "Indicators that determine when a market is in an overbought or oversold condition." From these two definitions, we can conclude that both momentum and oscillator are generic terms. Figure 2 shows the daily chart for Intel with three different oscillator indicators plotted below the price bars.
As clarifying and concise as these definitions are, price momentum can be better understood by comparing it with physical momentum. To do so, let us examine the physical momentum characteristics of a pendulum and then compare that with price momentum. Finally, we will look at some examples of a stock's price momentum and its correlation to price direction.
This article will be about momentum in general, not any particular indicator. Subsequent articles will address specific momentum indicators, but for now, let's begin with the basics of physical momentum.
PHYSICAL MOMENTUM BASICS
A pendulum shares two characteristics, momentum and oscillation, with price momentum. A pendulum is familiar to anyone who has seen a grandfather clock or taken an elementary physics course. Former physics students should remember that the momentum of an object is the product of mass and velocity. British philosopher and scientist Sir Isaac Newton explained momentum as an objectÕs propensity to keep moving in a straight line at constant speed unless acted on by an external force.
Oscillation is the steady, swinging movement of the pendulum. With each oscillation, the pendulum loses a little energy due to friction in the bearing of the pendulum rod. Energy is also lost due to the resistance of air molecules. The clock pendulum slows down with each swing and finally stops, unless an amount of energy, equal to that lost, is added back to the pendulum motion.
Stuart Evens is a Staff Writer with STOCKS& COMMODITIES
Excerpted from an article originally published in the July 1999 issue of Technical Analysis of STOCKS & COMMODITIES magazine. All rights reserved. © Copyright 1999, Technical Analysis, Inc.
Return to July 1999 Contents