NOVICE TRADER
Identifying Crucial Support And Resistance Levels
by Ned Gandevani
A look at market movement tells us that price fluctuates between a level of support and a level of resistance. Recognizing key support and resistance levels can improve our ability to enter, exit, and manage our trades. So how can we determine which support and resistance levels are the most important? Looking at an intraday S&P price chart, we find a multitude of such levels -- and the market pays respect to some, while it completely ignores others.

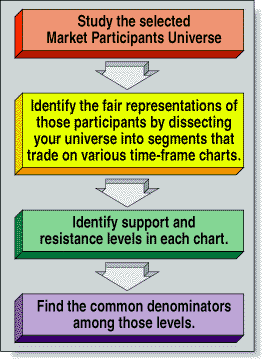
FIGURE 1: FLOW CHART. Here are the steps to identify common numbers for the market of your choice.Many different approaches are used to identify support and resistance levels in the market, but a great number of them are unreliable. These approaches include but are not limited to some methodologies that utilize Fibonacci numbers and ratios, trendlines, moving averages, and Gann concepts. Those techniques have a static view of the market. Those approaches assume that the market will repeat past behavior and experience and can therefore be viewed linearly. They also use fixed intervals for inputs, which creates yet another problem.
The market is not a static phenomenon. We cannot expect the market to disregard all the changes of economic and industrial macroforces that exert pressure on price movements. The market is most certainly a complex and dynamic phenomenon, but it is clear that price fluctuates between levels of support and resistance. How can we identify these levels in advance?
THE PSYCHOLOGY
First, let's review the psychological concept of support and resistance in the market. What does support and resistance mean and how are they significant to price movement? Support is a price level that indicates a temporary fair value of a tradable for the market. Prior to that level, sellers sell the market because they view it as overpriced. The market is pushed down to a level at which buyers step in with more money to hold price at the new level.
At that time, both sellers and buyers have made a decision regarding the market valuation based on their individual systems of valuation. If the buyers perceive this new level to be a good price for the market, they could flood the market with more buying pressure to hold the new level and eventually cause the price to rise. In the case of resistance, buyers keep pushing price higher with buying pressure because of the good opportunity. At perceived excessively high price levels, however, sellers enter the market looking for the opportunity to sell at inflated prices with higher volume, therefore creating resistance.
With this understanding of the basics of support and resistance, it seems logical we should contact all of the available market participants, survey their opinions regarding fair pricing, and then establish price values of support and resistance. This is, clearly, unrealistic. However, representation for all market participants would give us a clue as to the common levels of support and resistance -- levels common to all participants.
Ned Gandevani developed the Winning Edge S&P day trading methodology, a nonmechanical trading method based on chaos theory. For more information, visit his Website at www.winningedgesystem.com or E-mail him at Gandevani@worldnet.att.net.
Excerpted from an article originally published in the July 1999 issue of Technical Analysis of STOCKS & COMMODITIES magazine. All rights reserved. © Copyright 1999, Technical Analysis, Inc.
Return to July 1999 Contents