NEW TECHNIQUES
Pseudo Securities For Technical Analysts
by Charles E. Miller
Last time, we examined the idea of using pseudo securities, based on artificial data with known properties, to map the characteristics of various indicators. We then applied this concept to the time domain of security analysis. In this, the second of a three-part series, we explore the actual technique used to generate pseudo security data.
When working with pseudo securities, as with anything else new on the computer, it is generally common sense not to experiment within your working application. For ProTA, BeeSoft's technical analysis software for the Macintosh, I suggest that you set up a second, dedicated copy of your technical analysis application with your preferences and settings, but with initially empty ticker files. Working in this resulting smaller file ensures that your experiments won't disturb your normal settings and preferences, nor your ability to do your daily work.

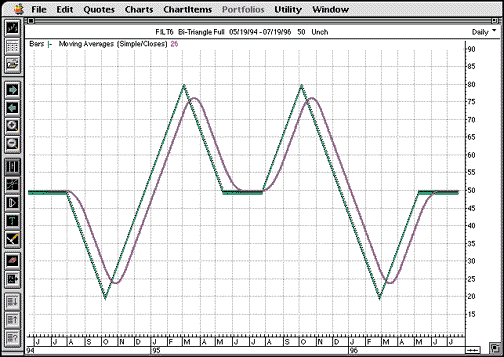
FIGURE 1: SIMPLE MOVING AVERAGE. The triangle wave provides numerous opportunities to gain new insight into the cause/effect relationships of various moving averages.One trap this avoids is the conflict with the data vendor update. Since each waveform represents a pseudo security, data vendors do not recognize them if they are included in your working program data update requests. Such requests can lead to data download problems.
The specifics of how to generate pseudo securities in an Excel spreadsheet and then import the finished quote file into ProTA are detailed in the sidebar, "Building your own pseudo security waveforms." Here are some other considerations for when you begin to generate your own time domain pseudo securities.
PSEUDO SECURITY CONSTRUCTION
Adequate separation of sequential market highs and lows is essential for back-to-basics testing. This allows the indicator response to settle out completely between turns (highs and lows), yielding a true cause/effect view. Using a sequence of 50 price bars before and after each turn -- 550 days total, in the case of the time/amplitude symmetrical double triangle wave seen in Figure 1 -- is usually sufficient with most default indicator settings to allow the response from each change to be seen as independent. Adding a few hundred extra bars at the beginning of the file will ensure coverage of the pseudo security if indicators require large numbers of bars for construction (for example, a 200-day moving average). Conversely, it will be instructive to later program in other waveforms some or all of the successive turns close enough to see the often-surprising effects due to interference resulting from insufficient isolation.
Approximately four years of trading dates (1,000 days) should be imported from ProTA into Excel and stored as a template. When generating any pseudo security, this x-axis data can be used to eliminate the weekends and holiday dates that otherwise would produce jagged results in ProTA. For MetaStock devotees, because MetaStock manages insertion of data into the ticker database in a different manner, it does not require the trading dates to be incorporated into the spreadsheet.
Charles E. Miller is an electrical engineer by training and a private investor by inclination. After 12 years as a development engineer at General Radio Co. (now GenRad), he joined the electrical engineering department at the Massachusetts Institute of Technology (MIT). He is now retired from 24 years of teaching at the Stroboscopic Light Laboratory at MIT. He continues to consult in a variety of fields, particularly high-speed and ultra-high speed imaging through his company, Northpoint Labs. He may be reached via E-mail at cemcemcem@aol.com. Thanks go to Jeffrey Bizon of BeeSoft, Inc., and John Slauson of Equis, Inc., for their generous support.
Excerpted from an article originally published in the July 1999 issue of Technical Analysis of STOCKS & COMMODITIES magazine. All rights reserved. © Copyright 1999, Technical Analysis, Inc.
Return to July 1999 Contents