TRADING TECHNIQUES
Correlation Among Stocks
by Michael P. Turner
If you are trading stocks, you may find opportunities by tracking the correlation between them. This can lead to different strategies such as trading one company off of another's news, spread trading, and sector trading. The techniques described here were adapted from the book Day Trading Into The Millennium, available from https://www.tradersresource.com.

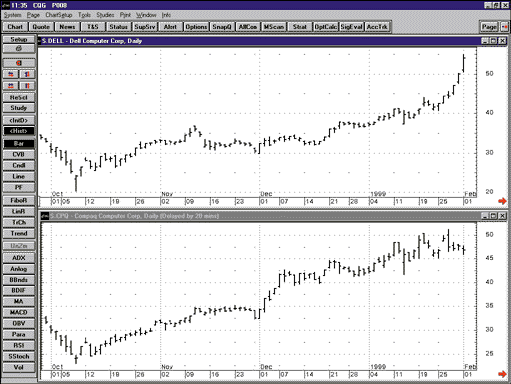
FIGURE 1: DELL VS. CPQ. You can see that from October to January, Dell (top chart) and Compaq (bottom chart) were positively correlated.A correlation coefficient is described by a range that spans from -1 to 1. Securities that are positively correlated will move in tandem with one another and have a correlation coefficient value near or at 1. Stocks that are negatively correlated will move opposite one another and will have a correlation coefficient near or at -1.
For example, Dell Computers (DELL) and Compaq Computers (CPQ) are two stocks that often have a positive correlation (Figure 1). If they were 100% positively correlated (+1), then a one-point move up in DELL would be matched by a one-point move up in CPQ. If these two stocks were 50% positively correlated (+0.5), then a one-point move up in DELL would be matched by a half-point move in CPQ. If these two stocks had zero correlation (0), then DELL might have a move up of one point, but CPQ would not move at all. For an example for negative correlation coefficients, AZN (Astrazeneca) and ABT (Abbott Labs) from mid-March to mid-April is a very good one. Similar prices and percentages move in opposite directions (Figure 2).
DEGREE OF CORRELATION
When stocks are positively or negatively correlated, movement in one stock is followed by movement in other correlated stocks. The degree of correlation, positive or negative, will determine the degree to which prices of correlated stocks move together. And in the same way that different stocks have some degree of correlation to one another, different sectors, which are made up of groups of related stocks, are correlated to one another. Taking this concept one step further, it becomes clear why there is a correlation between different broad market averages, such as the Dow Jones Industrial Average (DJIA), the Standard & Poor's 500, and the Russell 2000 (Figures 3, 4, and 5). The correlations can be carried out to the observation that different global markets are correlated to a varying degree.
Daytrader Michael Turner can be reached at https://www.tradersresource.com.
Excerpted from an article originally published in the July 1999 issue of Technical Analysis of STOCKS & COMMODITIES magazine. All rights reserved. © Copyright 1999, Technical Analysis, Inc.
Return to July 1999 Contents