YAHOO! FINANCE
https://quote.yahoo.com
Yahoo!, a leading Website directory, also offers a site-within-a-site at https://quote.yahoo.com for quotes, charts, and financial information. Here, you can check delayed quotes, view basic charts, and access a range of news and fundamental data. You can perform some basic fundamental analysis on stocks and mutual funds. You can research equities by industries. You can even access data on foreign markets. A well-rounded site, it also provides information on consumer products such as mortgage loans and auto loans.

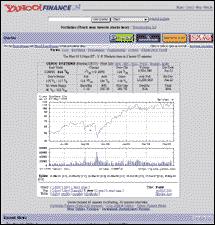
Yahoo basic chart
Input a symbol and get a delayed, extended quote, a simple chart, and links to news. You can choose to view the chart with a 200-day and 50-day moving average or plot prices against the S&P 500. The timeframes are far ranging: View a chart with todayÕs intraday activity; view a line chart of five days' intraday prices; view a bar chart from three months to five years; or view a chart with all available data. Display the chart in large or small format or even view the historical data in a table. You can also view a table of dividends.
Right from the chart, you can choose to review news headlines for your symbol with links to press releases posted at Yahoo! or links to other financial news sites; view SEC filings; and check company profiles provided by MarketGuide. Under the Research menu item, ZackÕs furnishes reports that include brokerage recommendations, earnings estimates, and earnings history. And if you have too much time on your hands, you can read messages posted at the message board for your symbol. Setting up and editing a portfolio is very easy.
CBS MARKETWATCH
https://cbs.marketwatch.com
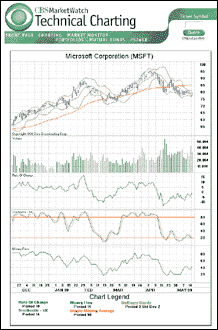
Along with the news stories it's known for, CBS MarketWatch offers a technical charting area for market technicians. Clean-looking and easy-to-use charts give you options to plot technical indicators and studies from moving averages to linear regression to money flow, on either bar or candlestick charts.

CBS MarketWatch MSFT chart
Among the other offerings at the Website, CBS MarketWatch offers news, fundamentals, insider sales reports, broker research, a message board, option chains, DSP/DRIP information, Hoover's Capsules, SEC filings, and fund profiles. News can be accessed by symbol, from a category index, or by search.
Scroll to the bottom of the homepage for links to five areas: Market Data, Market Monitor, Charting, Portfolios, and Trading Center. Key data available from the Market Data page includes 52-week highs and lows; an IPO calendar; analyst upgrades and downgrades; index components; bond forecasts; mutual fund information; most actives; volume leaders; currency snapshots; and a research area offering a convenient list of links to other areas of the site, including a glossary, an investing primer with original articles, and a stock screener.
Market Monitor gives you quotes on market indices. At the Portfolios page, you register to keep an eye on an unlimited number of portfolios with up to 200 symbols each. The Trading Center merely presents links to various brokerage firms.
From the Charting link, you can plot up to five studies at once on a chart, selecting among several studies across five categories. To set up a chart, you select between three moving average types (simple, weighted, exponential); between Bollinger bands, regression, and envelopes; between OBV, RSI, momentum, average true range, rate of change, and accumulation/distribution; between stochastics, price oscillator, and MACD; and between money flow and Williams' %R.
Each of these selections start with default values for the indicator or study, and from there you can select your own parameters and save your choices. A technical glossary explains each indicator offered. The market data is provided by DBC.
Timeframes for charts run from three months to five years. A one-year chart can be displayed with daily or weekly data; three- and five-year charts are displayed with monthly data only.
PROPHET INFORMATION SERVICES
www.ProphetCharts.com
ProphetCharts is a free Java-based chart service. At ProphetCharts.com, you can chart stocks, mutual funds, and indices. If you don't know the symbol, search for it in Prophet's symbol database. Then select a security from the list matching your search criteria.

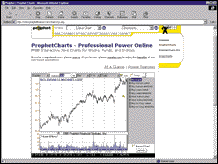
ProphetCharts
You can change the chart type and duration by selecting from the menus or use the Tools menu to post your choice of technical studies. Studies available from the Tools menu include: compare to index; compare to another equity; simple and exponential moving averages; MACD, RSI, and Williams' %R; and fast and slow stochastics. You can expand the chart to display full screen by detaching the chart from the window and resizing the applet window. You can zoom into a portion of a chart by dragging across the section of the chart for which you want a closer look. Charts can be printed.
The default chart setting is equities; to chart futures, futures options, or equities options, select from the menu in the upper-left of the charting application.
The Log checkbox lets you change the grid scale from linear to logarithmic. The Color checkbox provides red bars for declining volume in all types of graphs. It also shows red indicators for declining prices in bar and candlestick graphs. The crosshair cursor allows you to draw accurate trendlines and gives readouts of specific dates and pricepoints.
Futures charts can be graphed in continuous contracts showing the price of the nearest contract, as well as volume and open interest.
The My Charts feature remembers the last 100 symbols you chart. Just off to the right of the charting area, a hotlist lists the dayÕs most active stocks.
Clicking on the name of a chart provides links to other Web sources for news, quotes, commentary, research, and discussion for that stock.
Also from Prophet Information Services, the ProphetDirect end-of-day data service now supports Canadian stock data, futures options data, stock options data, and index options data. ProphetDirect offers US stock data back to 1968; mutual fund data back to 1988; index data back to 1910; and futures data back to 1959. ProphetDirect data can be used with many popular charting programs, such as SuperCharts, MetaStock, TradeStation, OptionStation, Window on WallStreet, and Wall Street Analyst.
TELESCAN'S WALL STREET CITY
www.telescan.com/Telescan_Prod_WSC.htm
The Wall Street City site from Telescan. provides free real-time quotes, intraday charting, and technical analysis, as well as a host of other resources including market commentary, industry group analysis, portfolio management tools, educational tools, discussion groups, and securities research and analysis. A search engine assists beginner and advanced users.

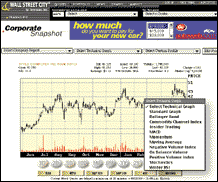
Wall Street City
Enter a quote to display a quick chart with links to other features. Other features include a company profile, Comtex or Reuters news, earnings reports, listed options, Telescan rankings, and Vickers insider trading reports.
Charting features and options include:
Free real-time quotes: Exchange registration required. Register for free real-time quotes for securities listed on the New York, American and Nasdaq exchanges. Quotes are provided by Telescan's trading partner, Web Street Securities.
Corporate snapshot: View a graph and get breakout alerts, search reports, and news.
Macro*World projection: View a graph of past performance with a projection of future performance.
Comparison: Enter up to 10 symbols to view a relative performance graph.
Industry: View a graph comparing your stock's return to its industry group.
TIP graph: View a graph using technical indicators and charting tools.
Technical analysis: Post indicators one at a time (such as Bollinger bands, MACD, CCI, momentum, positive/negative volume index, insider trading, OBV, stochastics, and RSI). From below the chart, you can change the indicator parameters.
Display charts in time frames from one or two days of intraday data out to 10 years or the maximum available data.
Originally published in the August 1999 issue of Technical Analysis of STOCKS & COMMODITIES magazine. All rights reserved. © Copyright 1999, Technical Analysis,Inc.