Chart Patterns That Repeat
Replicharts
by Zack Hill
Certain chart formations can forecast major trading activity. Take a look.
Answer me this. If we can accept that established patterns occur in cloud formations, crowd psychology, and criminal behavior, why can't we also accept that stock charts have patterns that repeat with similar reliability? Since stock charts display the buying and selling of a crowd, why not assume that reactions to certain events would be quite predictable, just as they are in our everyday lives?

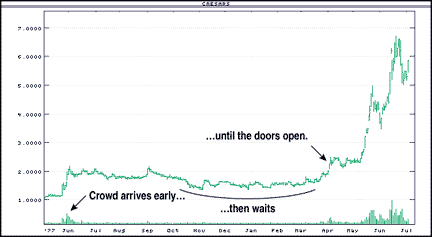
FIGURE 1A: THE EARLY CROWD. Four different stocks in four different time frames show the crowd getting in as much as a year before liftoff. Recurring patterns such as this one can be found either by a cursory glance or computerized scanning.
Here's an example. My wife and her mother went shopping one morning recently. They pulled into the parking lot and immediately noticed two things: First, they saw that the store hadn't opened yet. Second, they observed that there was already a crowd waiting for the store to open. This was unusual, so, curious, they joined the crowd and waited, sensing something really good must have been advertised that they weren't aware of. Asking no questions (for fear of appearing to be out of the loop), the two followed the other shoppers when the store finally opened, to a big display of a specially marked item. Within 10 minutes, the item had sold out completely, including the one that my wife bought, thanks to those patient early shoppers!
¥ THE EARLY CROWD PATTERN
And here's why I told you that story: look at the four charts in Figure 1. All are from different stocks, different years, and different industries, yet the patterns look remarkably alike. Using your imagination, can you see in these charts where the crowd rushed up to the door, but patiently had to wait for the store to open? Once the doors opened, it became obvious to everyone, including my wife and her mother, what all the excitement was about. The key to this pattern is the crowd that forms and waits.
¥ SPIKES PREDICTING GOOD THINGS TO COME
How about those depressing days when one of your stocks goes screaming straight up, only to reverse and close almost unchanged for the day? Don't stay depressed for too long. Many times, this is a signal that, first of all, somebody was very interested in buying your stock, second, few people were interested in selling initially and that's why it shot up so much, but third, because there was no hard evidence yet of why it should stay up, enough sellers took it down by the close. If, over the next few weeks (or even months), the stock starts to rise to higher ground, hang on; the fun could just be starting. The early sign was that one-day spike.
Zack Hill spent 25 years as a stockbroker with two major Wall Street firms. He has done extensive research in technical analysis with an emphasis on price/volume relationships. He can be reached at hillpeak@aol.com.
Excerpted from an article originally published in the April 2000 issue of Technical Analysis of STOCKS & COMMODITIES magazine. All rights reserved. © Copyright 2000, Technical Analysis, Inc.
Return to April 2000 Contents