Are Your Profits Robust?
by Steve Notis
Your trading system probably has a set of parameters you think are the most profitable. But is it the most consistent? Here's a technique to find the most robust set that will give you regular profits.
For those who use trading systems, the most important concern should not be to find parameters that yield the greatest profit; rather, it should be to find the most robust parameters. Anyone can tweak a system until it shows startling results, but unless those parameters are robust, they will not hold up in real-world trading.

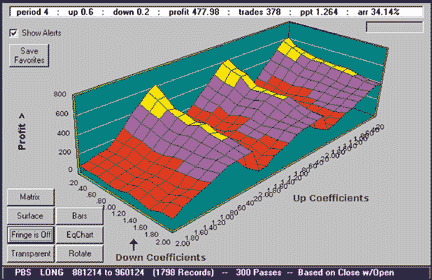
FIGURE 1: S&P SURFACE CHART. A three-dimensional chart of profit vs. long and short parameters shows where the trading rules are likely to be effective. The surface chart shows areas of high and low profits corresponding to varying the system's parameters. High plateaus denote stable areas with robust parameters.
Several testing methods can be used to increase a system's robustness. The first, and simplest, is to test over long periods. This assures that the test includes a variety of market conditions. The second method is the walk-forward, or blind, data test. This typically consists of optimizing trading parameters over a long period, but stopping short of the present. Finally, the best parameters are tested over the remaining, nonoptimized, data. This is also referred to as walk-forward, blind, virgin, out-of-sample, and it has even been referred to as real-time testing.
If the optimized parameters work well over the blind data, then it can be argued that the parameters are robust and likely to continue to work for some time into the future. Since the final test is run without the benefit of hindsight or optimization, it's as close to real trading as you can simulate with historical data. However, don't assume that the most profitable parameters are the best parameters -- meaning those that will be the most profitable in the future.
THE 3D SURFACE CHART
The best way I've found to ferret out robustness from an otherwise obtuse table of parameters and profits is by plotting those parameters and profits into a three-dimensional matrix, or surface chart (Figure 1). If you develop your trading systems in Excel or a similar spreadsheet, then this type of chart is usually built in and easy to use.
Use a three-dimensional surface chart to visually locate groups of reliable parameters. When an optimization is run, each parameter has a range of values to be tested. During the optimization, every combination of parameters and values is tested in turn for profitability.
When you test your system using a specific set of parameters, you generate an equity line for those parameters. Each set of parameter values generates its own distinct equity line. The final profit of each equity line is plotted on the three-dimensional surface chart and becomes the vertical height of one of the tiles. Each rectangular tile represents the equity, or profit, generated by one set of tested parameter values. All the tiles combined give you a topographical representation of the "profit landscape," from which you can visually select areas that show robust parameters.
Steve Notis heads Byte Research at https://www.byte-research.com. He can be reached at Steve@byte-research.com or 516 981-1841.
Excerpted from an article originally published in the April 2000 issue of Technical Analysis of STOCKS & COMMODITIES magazine. All rights reserved. © Copyright 2000, Technical Analysis, Inc.
Return to April 2000 Contents