NEW TECHNIQUES
Ram Trading
by Lorne W. Rae
With this simple daytrading method using candlestick formations and the opening action, this author demonstrates a high-probability, low-risk trading strategy that gets you in and out in a single day.
Just as the battering ram had a single purpose in the earliest wars -- namely, punching a hole in a barred city gate -- what I refer to as the Ram trading method is focused on a singular goal: to identify and implement low-risk trades that make money.

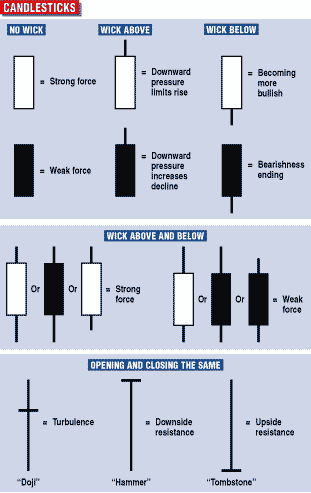
FIGURE 1: INDIVIDUAL CANDLESTICKS. Candlesticks can convey a range of psychological conditions.
To a trader, time is all-important. For stock traders, the shorter the time interval between buys and sells, the less likely it is that something will go wrong. Ram trading minimizes this risk by concentrating on the shortest of trading time units -- a fraction of a trading day. For consistency's sake, the terminology in this analysis assumes that "right now" is just prior to today's opening of trade.
STOCKPRICING
Candlestick analysis is one technique that concentrates on short-term price movement. It is an excellent method for determining today's likely price trend. There is extensive literature about candlesticks, and there are software packages to do the charting. Candlesticks are simple to use, and all a trader needs are three or so days of prior price action to produce proper results.
Candlestick analysis utilizes a stock's open, high, low, and close to produce a chart of daily price movement to indicate current market psychology. The body of the candlestick represents the price movement between the open and close, and the wicks, if any, depict the intraday price extremes. A white candle represents a stock that rises, while a black candle represents a stock that declines. When the opening and closing prices are the same, there is no candle at all. These charting characteristics result in a number of candlestick pictures, each of which depicts a different psychology. The more common ones can be seen in Figure 1.
Lorne W. Rae, CFA, is an investment advisor and partner with Sterling Asset Management in Vancouver, British Columbia, Canada. He can be reached at lrae@sterling–asset.com. The author thanks David Merrill for his assistance.
Excerpted from an article originally published in the April 2000 issue of Technical Analysis of STOCKS & COMMODITIES magazine. All rights reserved. © Copyright 2000, Technical Analysis, Inc.
Return to April 2000 Contents