TRADING TECHNIQUES
Chaikin's Money Flow
by Christopher Narcouzi
An indicator combining price and volume could spotlight buying and selling, and Chaikin's money flow is such an indicator. Use it with basic charting techniques to increase your chances of success.
Most momentum measurements and oscillators use only price in their calculations. To use several such indicators is essentially redundant, since they tend to be highly correlated; another indicator should be considered, one that is not highly correlated with momentum and oscillators. Trader and analyst Marc Chaikin's money flow fits the bill. It uses price and volume to give you a look at what is going on under the surface of the price action. It gives you a picture of the supply/demand situation and shows you whether the stock is under accumulation or distribution. I use this indicator to confirm breakouts from chart patterns.

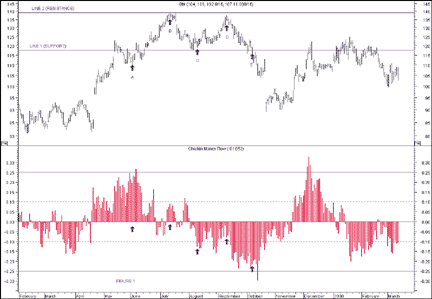
FIGURE 1: MONEY FLOW. IBM falls after money flow declines, indicating less support for the stock. A money flow decline presages a fall in the stock price.
DEFINITION
Chaikin's money flow is based on Chaikin's accumulation/distribution. Accumulation/distribution, in turn, is based on the premise that if the stock closes above its midpoint [(high+low)/2] for the day, then there was accumulation that day, and if it closes below its midpoint, then there was distribution that day. Chaikin's money flow is calculated by summing the values of accumulation/distribution for 21 periods and then dividing by the 21-period sum of the volume.
Marc Chaikin recommends using a 21-day period representing a month, but other periods can be used as well. Most software includes this indicator. Chaikin comments that, very often, volume divergences versus price movement are the only clues to an important reversal that is about to take place. In general, Chaikin's money flow tends to be bullish when it's positive and bearish when it is negative. At point A in Figure 1, Chaikin's money flow indicates that buying was intense. As a result, the stock continued its move up. However, from there on, Chaikin's money flow declined markedly, indicating that buying pressure was declining significantly and that a top could be near.
The stock reached a top at point B. From the top of points B to C, there was some weak selling, but the support at line 1 held. As the stock advanced to point D, money flow went negative, indicating that the resistance at line 2 was going to hold. To break through this resistance line, heavy buying pressure was needed.
On the move from points D to E, selling pressure intensified dramatically as the money flow went further south, indicating that support line 1 would not hold in the event the stock broke below support at point E. Chaikin's money flow gave an advance warning that a top was near before the top at point B actually occurred, and also gave an advanced warning that support line 1 was not going to hold.
Christopher Narcouzi is a director of information technology in Quincy, MA. He can be reached at cnarcouz@erols.com.
Excerpted from an article originally published in the August 2000 issue of Technical Analysis of STOCKS & COMMODITIES magazine. All rights reserved. © Copyright 2000, Technical Analysis, Inc.
Return to August 2000 Contents