INDICATORS
Trading Stochastic Pops
by David Steckler
You can identify breakouts using stochastic pops. What are they, anyway?
Many equity traders strive to identify stocks that are ready to break out and begin a sustained price move up. The difficulty lies in identifying which stocks are getting ready to break out and determining when the breakout will occur.

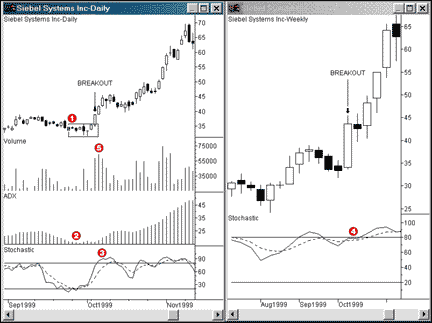
FIGURE 1: SIEBEL SYSTEMS. Just as SEBL breaks out of its consolidation, stochastics go over 70 and prices pop to twice what they were before.
One technique I like to use to identify breakouts is the stochastic pop. The "pop" comes about when the stochastic indicator goes above the 70 to 80 level. Instead of reversing, however, the stock keeps going and momentum continues to rise. "Stochastic pop" is actually a misnomer, since the pop is in the price, not the stochastic. The stochastic itself stays above 70 or 80, held there by the price moving up and staying high in its daily ranges.
SETUP CONDITIONS
I identify a stochastic pop setup when the following conditions occur:
1 Recent price action in a tight daily consolidation range
2 Daily average directional movement index (ADX) below 20 (preferably below 15)
3 Daily stochastic %K above 70 (preferably above 80) and rising
4 Weekly stochastic %K above 50 and rising
5 Stock breakout on above average volume, and
6 Bullish market conditions.
The stochastic pop is not new; trader and author Jake Bernstein wrote about this phenomenon years ago. The setup conditions I added are refinements that increase the odds of success by requiring confirming signals from both the daily ADX and weekly stochastic signals. Keep in mind, of course, that the past performance of this strategy is not an indication of future success. I utilize this methodology using daily and weekly charts to trade equities.
THE ADX INDICATOR
The ADX indicator, developed by J. Welles Wilder, measures the strength of a trend. The index uses a scale between zero and 100 to rate the trendiness of a stock or commodity. (See sidebar "The ADX indicator.")
The ADX identifies whether the stock or commodity is trending. However, it does not reveal the direction the stock is trending, only that it is trending: The stronger the trend, the higher the ADX value. A rising ADX value suggests that the present trend is gaining strength, while a falling ADX value suggests the present trend is losing strength. A common interpretation of this indicator is that a stock or commodity is trending when the ADX passes through 30 and is rising.
David Steckler is an affiliate member of the Market Technicians Association and has traded stocks and commodities since 1989. In addition to trading, he is an adjunct professor at Lindenwood University, St. Charles, MO, teaching classes in business law, investments, and personal finance. He may be reached via E-mail at Dsteckler@aol.com.
Excerpted from an article originally published in the August 2000 issue of Technical Analysis of STOCKS & COMMODITIES magazine. All rights reserved. © Copyright 2000, Technical Analysis, Inc.
Return to August 2000 Contents