![]()
![]()
PRISTINE.COM
Pristine has enjoyed a reputation as one of the leading providers of educational services catering to the self-directed, active trader. Since its inception in 1994, the company has expanded to provide educational services to traders around the world. A visit to the company's Website is a gateway to the array of services offered by Pristine. Pristine's objective is to provide services to convert amateur traders into professionals by introducing them to swing trading.

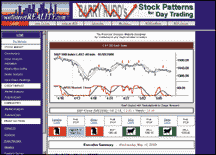
FIGURE 1: PRISTINE.COM. Pristine's Website offers many investor services with an emphasis on investor education. Pristine also has training/trading centers around the country.
The Website offers both free and premium services. Free services include the following:
- Chart of the Week--Updated every Monday and includes a large, clear chart of one stock. In addition to the chart, you get to view the technical commentary to make sense of the implications of the chart. The chart of the week is accompanied by a focus stock list, which is a list of stocks that exhibit the potential to move up. Also included is a glossary of common trading terms and an explanation of the various types of trades.
- Stock Play of the Week--Also updated every Monday morning and discusses one stock. It shows a display of the chart along with a brief company profile. A trading strategy plus the profit objective of the trade is also included.
- Mark to Market--Trading stories from Jeff Jessum, instructor and head of Pristine's Northwest operations, and Mark Montgomery, instructor and trader.
- A Trader in Training--Articles focused on the psychological aspects of trading, which is an important component of trading.
- Ask Pristine--A section that lets you ask questions of the editors. They select one question per day and post the answer to the site.
- Educational Reports--Contains several articles that serve the purpose of teaching individuals to trade.
- Recommended Reading--A list of books that traders will find helpful.
Premium services include:
- Pristine Day Trader--A newsletter-type service that includes a discussion of a technical indicator and a list of short-term plays indicating entry points, stops, and profit objectives. This is followed by a list of stocks on their watch list plus an update on open positions. There's also an article on the trading plan. All this gets updated daily.
- Pristine Lite--A service catering to the novice trader. The stocks selected for this category are those displaying high relative strengths and a price between $5 and $40. It includes a chart of a selected stock with its trading strategy for the day. An update on open positions plus stocks to watch is also included. You can also find the Pristine Lite Master Trading Plan here.
- Pristine Trading Room--Members can enter the trading room to hear updated news items. It's a virtual trading room where you can chat with other Pristine traders.
- Pristine Market Gems--Includes a list of stocks to watch for the current trading day.
- Pristine ESP--Software produced by Pristine that lets you screen stocks based on specific criteria such as breakouts and so on.
- Pristine Private Student Network (PPSN)--Lists both long and short candidates. You can see both in chart and text formats.
- Pristine Daily Hotline--Subscribers receive two messages per day, the first one an hour after the market opens, and the second a half hour before the close.
The cost of these services can be found at the Website.
In addition to the services offered over the Website, Pristine also offers seminars and has training centers around the world. Seminar and course schedules are posted at the Website. After completing the course, students have the option to trade on Pristine.com premises or trade independently.
I had the opportunity to visit one of their training centers. The class, which was taught by Robert Lord, was restricted to a maximum of eight students. Each desk is equipped with a direct-access broker that provides a real-time datafeed. The course duration is two weeks and students are taught the art of trading. To prepare the students to make their own trading decisions, a considerable amount of time is spent familiarizing them with Level II quotes, candlestick charts, technical analysis indicators, money management, and conducting trading as a business. Even though the latter part of the course is dedicated to paper trading, students are encouraged to continue paper trading after completion of the course.
The contents of Pristine's Website are helpful to both beginning and experienced traders. Since the company is focused on educating aspiring traders, most of its services revolve around education. Even the daily recommendations are created with the intention of educating traders.
STOCKSMART.COM
A Website where you can get stock quotes, news, charts, research reports, information on world markets, mutual funds, currencies, and create custom portfolios is one worth bookmarking. Stocksmart.com provides you all this information for $19.95 per month or $215.46 per year.

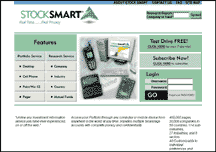
FIGURE 2: STOCKSMART.COM. Stocksmart.com offers stock quotes, news, charts, research reports, information on world markets, mutual funds, currencies, and custom portfolio creation.
Once you log onto the site, you'll see a page with a colorful bar chart showing an updated performance of the broader indices of the US and global markets. The information on this site is delayed by about 15 minutes. You'll also see a ticker scrolling across the top of this chart. Below the bar chart is an Industry Watch section, showing you the performance of the various sectors on that day. Below the Industry Watch section is the Winners and Losers section, showing the biggest gainers and losers. Those included in the list have a market cap greater than $200 million.
A click on any bar on the bar chart will take you to a page displaying several pertinent charts. For example, a click on the bar of the Dow Jones Industrial Average (DJIA) will take you to a page that displays the intraday chart of the DJIA, the daily chart, NYSE breadth advance/decline line, and the DJIA relative strength index.
The same applies to the Industry Watch and Winners and Losers section. Just click on any industry or bar and you will be taken to a page that provides more details.
FIGURE 3: STOCKSMART.COM. When you log onto Stocksmart.com , you get a colorful bar chart of the broader indices, on 15-minute delay. A click on any of the bars will take you to a page displaying several pertinent charts. Here, a click on the Nasdaq bar will take you to a page that displays the intraday chart of the Nasdaq, the daily chart, Nasdaq breadth advance-decline, and the Nasdaq relative strength index.
Across the top of the home page is a menu of various sections. To find information on a specific company, click on the "company" section. After entering a ticker symbol, you can get a detailed research report on the company providing just about any facts you may want, including charts, technical analysis, trading summary, short interest, and fundamental information.
The Industry section displays a list of the various industries and their performance, which gets updated when you hit the refresh button. You can click on any of the divisions/subdivisions and get details such as a list of stocks in the group and their performance.
The News section provides you with market news, earnings, IPOs, mergers/acquisitions, as well as news from various regions of the world.
The Most Active section lists the most actively traded stocks on the NYSE, Nasdaq, and AMEX. A click on the ticker symbol of a stock on the list will bring up quote details, technicals, earnings, past estimates, recommendations, and corporate actions such as stock splits and symbol changes. If you click on the company name, you can gain access to research reports, annual reports, EDGAR filings, and various charts; that is, about the same features available in the company section.
You can also access mutual fund ratings and the best and worst performers. If you're in the market for mutual funds, this is a good site to get an overview of the mutual fund market. It divides up the funds by type, giving you an idea of which sector funds are performing better than others. This can also give you insight into the sectors that are currently performing well.
The portfolio feature allows you to create your own portfolio. You may opt to receive your statements via E-mail daily, weekly, or monthly. You may also have alerts sent to your wireless device, although this would require an additional subscription.
This site certainly can be classified as one rich in content. The addition of real-time quotes and interactive charts would enhance its already existing rich set of features.
Originally published in the August 2000 issue of Technical Analysis of STOCKS & COMMODITIES magazine. All rights reserved. © Copyright 2000, Technical Analysis, Inc.