NOVICE TRADER
Here's A Tried-And-True Way To Identify Market Momentum
Nasdaq Advances -- Declines
by Dennis D. Peterson
Adjusting your trading signals to account for what's actually happening in the market can mean a nice profit for you.
Market indices can rise on the backs of just a few stocks. This is especially true with the Standard & Poor's 500 and the Nasdaq Composite, since both are weighted by market capitalization. Market breadth indicators that can picture the entire market help traders and investors identify market momentum. The three measures typically used to characterize the New York Stock Exchange (NYSE), Nasdaq, and the American Stock Exchange (AMEX) are advances-declines, up/down volume, and new highs/new lows.

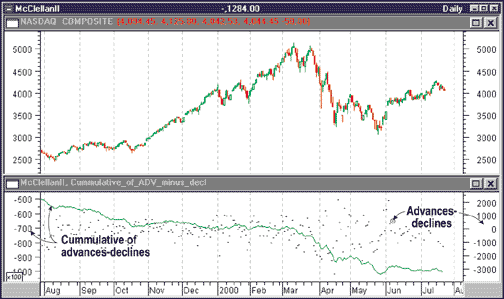
FIGURE 1: NASDAQ CUMULATIVE A-D LINE. The cumulative A-D line is the cumulative sum of daily advances minus declines. Nasdaq breadth narrows in 2000 and shows some flattening in the trend. The trend of the cumulative is the significant feature.
Since many older textbooks do not mention the Nasdaq, let's see what historical measures of breadth can do to help us understand Nasdaq momentum. One measure that has been used for a long time is the running total of advances minus declines. Figure 1 shows that for July 1999 through July 2000, there was a slow but steady erosion of breadth. Some flattening of the curve occurred with the small rally during June and July 2000, indicating that the Nasdaq rose on the backs of the equities with large market capitalization. This fit with analysts' view that only the strongest companies would survive, pointing out that many Internet companies were struggling. The flattening indicated that breadth improved; that is, advances were equaling declines.
Trendlines drawn on the cumulative A-D in Figure 1 would only show a downtrend. Certainly, as a means of predicting short-term or intermediate-term trends, the cumulative A-D is not a good source. What it does show, however, is that the November 1999 through mid-March 2000 uptrend in the Nasdaq was diverging from the downtrend in the cumulative A-D for the same period, leading the eventual downturn.
Dennis Peterson is a Staff Writer for Stocks & Commodities.
Excerpted from an article originally published in the November 2000 issue of Technical Analysis of STOCKS & COMMODITIES magazine. All rights reserved. © Copyright 2000, Technical Analysis, Inc.
Return to November 2000 Contents