Patterns Just Right For Daytrading
Two-Day Price Patterns
by Martin J. Pring
Coming at the end of a trend, these two-day patterns are solid signals of a reversal. Here's the last of Pring's three articles on price patterns.
Two-day price pattern formations, unlike others we have discussed, take just one or two days to complete and have a relatively short-term significance. I refer to them as "one-" or "two-day" patterns, but the wording could just as easily apply to weekly or monthly bars. I have even referred to this phenomenon on intraday charts as one- or two-bar price patterns, because that is what they are. In retrospect, it is probably better to use the generic "bar" rather than individual timeframes.
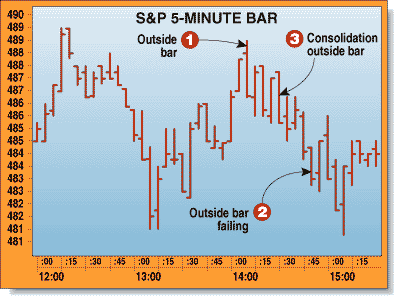
FIGURE 1: OUTSIDE BAR. Outside bars are bars in which the trading range totally encompasses that of the previous bar. They develop after both down- and uptrends and represent a strong signal of exhaustion. Here, you can see the low was achieved around one o'clock and the price zigzagged up for just over an hour. Then we reach a bar (1) that totally encompasses the trading range of the previous one. That is our outside bar. Note also the opening price developed at a higher level than the previous bar’s close, but the closing price of the outside bar was not only down on the period, it also closed below the lowest point of the previous bar.
We do not have the space to cover all the variations, so I will concentrate on the four that are probably the most useful. Let me begin with some characteristics common to them all.
COMMONALITY
First of all, one- or two-bar price patterns generally reflect an exhaustion point. In the case of an uptrend, they develop when buyers have temporarily pushed prices up too far and need a rest or, in the case of downtrends, they develop when there is little, if any, supply because sellers have completed their liquidation. Thus, such patterns are associated with a reversal in the prevailing trend.
Second, in order for these formations to be effective, there must have been something to reverse. This means that top reversals should be preceded by a meaningful rally, whereas bottom formations should be preceded by a sharp correction to be more effective.
Third, from the formation of these patterns, the implications are for a very short-term reversal. How short will vary with the time span of the bars. If we are studying daily bars, the new trend can normally be expected to last for at least three to five days, often longer. On the other hand, a one- or two-bar formation that can be observed in the intraday charts, such as a 10-minute bar, is likely to be effective for the next hour or two.
Fourth, not all patterns are created equal; it is important to interpret these patterns not so much as black and white, but as shades of gray. Some show all of the characteristics I will be describing in a very strong way, while others will reflect just a few characteristics in a mild way. What we might call a five-star pattern is more likely to result in a strong reversal than, say, a two-star pattern with mild characteristics.
Excerpted from an article originally published in the November 2000 issue of Technical Analysis of STOCKS & COMMODITIES magazine. All rights reserved. © Copyright 2000, Technical Analysis, Inc.
Return to November 2000 Contents