![]()
![]()
B4UTRADE.COM
The domain name says it all. Before you trade you need to do your due diligence, and this site contains the information you need to do just that. Although the Website is a little thin as far as technical analysis is concerned, it could still be beneficial if you selected stocks based on fundamentals but timed your entries and exits based on technical analysis. Screening criteria include CNBC appearances, stock splits, buybacks, and analyst upgrades/downgrades. There are more than 20 variables you can select, and there are plans to add another 20 in the near future.

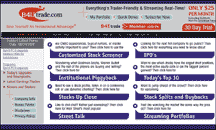
FIGURE 1: B4UTRADE.COM. This site provides traders with the necessary tools to conduct pretrading research.
The cost of the service is $25 per month, plus an exchange fee of $5 since you will receive real-time quotes. If you want to give this program a try, a 30-day free trial is available.
The homepage gives you an idea of the array of services available. You can screen stocks using the customized stock screener, determine which stocks are being accumulated by the institutions, research individual stocks, chat with others, get information on recent or future initial public offerings, find out what the day's top 10 movers are, determine which companies are splitting their stocks or planning buybacks, and create your own portfolio. In addition, you have a customizable scrolling ticker, a window with news updates plus links to the day's upgrades/downgrades, latest earnings flashes, and the movers and shakers.
FIGURE 2: B4UTRADE.COM. Historical charts are provided by Prophet Financial. They contain features such as indicators and drawing tools that technical traders will find beneficial.
The searches can be saved so you don't have to recreate them each time you log onto the site. For example, suppose you screen stocks based on companies that are expected to announce earnings soon and were upgraded earlier. Once you select the criteria, you can save this as a formula so you don't need to recreate it each time you log on. You may screen these further by industry, exchange, price, volume, and market capitalization. After making your selection, the system will search for all possible stocks that meet your criteria and display them.Click on each of these stocks to do an in-depth analysis. This includes quotes, analyst coverage, insider activity, institutional activity, earnings, news headlines, short interest, and institutional ownership.
You can also view historical charts provided by Prophet Financial. These charts contain technical indicators and drawing tools such as trendlines. These charts can be used to make decisions about when to enter or exit a trade.
Several features such as intraday charts, aftermarket activity, options quotes, time and sales, and Level II quotes will be added in the future. With the addition of these features, technical analysis screening criteria and a redesign of the site, B4Utrade.com would make a great one-stop site for pretrading research.
--Jayanthi Gopalakrishnan, Staff Writer
MARKETGUAGE.COM
MarketGauge.com provides analysis of markets, sectors, and industry groups using a wide spectrum of indicators, along with commentary. The visual presentation of the indicator values distinguishes MarketGauge from other Websites. The site came about as a result of two hedge fund traders who wanted to summarize market action and to identify hotspots. That makes sense when you enter the Website and discover you have the choice of two areas: MarketGauge or Market HotSpots.
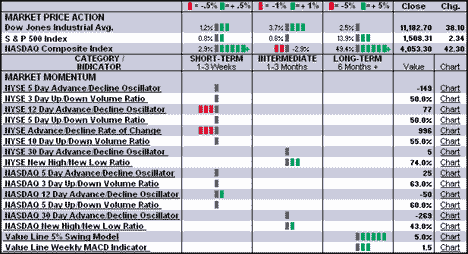
The MarketGauge section has seven menu items, including a users' guide. Four areas with daily updates are: Today's Gauges, Charts, Market Summary, and Spotlight. Today's Gauges provides Nasdaq Composite and Standard & Poor's 500 indicators in five categories: momentum, contrary opinion, monetary, fundamental factors, and smart money, and you can choose among three timeframes. More than 30 indicators cover the entire market spectrum, including such diverse items as mutual fund cash levels and OEX put/call ratio. Many of the momentum indicators (Figure 3) use advancing and declining stocks or the up and down volume. The number and color of the bars in the middle of the momentum display convey strength, based on bullishness or bearishness. Indicator updates occur daily or weekly, depending on the indicator.

FIGURE 3: TODAY'S GAUGES Ñ MARKET MOMENTUM SECTION. Formulas using advances, declines, up volume, down volume, etc. over different periods of time provide indicators of bullishness (green) and bearishness (red).
MarketGauge offers a professional version and a consumer version of MarketGauge. One of the differences will be the more comprehensive verbal summary that the pro version will provide from Maria Fiorini Ramirez, Inc. One part will summarize yesterday's market action in terms of major events shaping or reflecting the market outlook, various sectors, and industry groups. The other part will put into perspective what indicators may be saying about the bullishness or bearishness of the market.
FIGURE 4: MARKETGAUGE INDICATOR CHART. Indicators are often shown in pairs with the relevant index. Thresholds are part of any chart indicating bullishness or bearishness.
Clicking on Chart in the righthand column of Today's Gauges (Figure 3) produces charts. One chart is always the indicator; the other is the market index. Display of two indicators is common (Figure 4); which two indicators are displayed is predefined. Overbought and oversold, or bearish versus bullish, thresholds are on all charts.
FIGURE 5: INDEX SUMMARY. MarketGauge provides several summaries. Market index summary uses the same interface -- colored bars -- as do the Today's Gauges screens to alert investors to market trend.
Included is an Index Summary (Figure 5), as well as sector and industry group summaries. The professional version includes in-depth commentary about the market, sector, and industry groups and a bond market summary. The consumer version of MarketGauge also provides commentary. The summaries provide percentage price change and average volume. Depending on the summary, the price change is today's price percentage change (Index Summary) or change in market capitalization (Sector Summary). Volume comparisons are today's volume versus the 30-day average volume.The Spotlight selection provides a weekly look ahead. Using verbal descriptions coupled with insights for summary charts goes beyond just having colored bars indicating price action.
FIGURE 6: HOTSPOTS SECTOR SUMMARY. MarketGauge calculates price change activity for pre-defined indices, and then, with price and volume change, the sectors and industry groups that have the most change.
The HotSpots section provides the means to focus on the parts of the market contributing to price change at the index level, and then price and volume at sector, industry group, and stock levels (Figure 6). HotSpots is provided on an intraday basis, while MarketGauge indicators are updated at end of day. The menu line previews the progression of searching that is possible. Column data can be sorted by ascending or descending order, and by the best and worst. A yellow background indicates the user's current choices or position in the search.
FIGURE 7: SORTING THROUGH INDICES, SECTORS, AND GROUPS WITHIN HOTSPOTS. MarketGauge allows sorting down to individual stocks. Perform further analysis using a link to BigCharts. A portfolio feature is also available.
At the final level (Figure 7), individual stocks are available with a link to BigCharts, news, and a portfolio option. The header portion of the display retains the path taken to get to a lower level, in this case starting with the Nasdaq, and then to the basic materials sector, on to fabricated products, and finally the best and worst. The bottom of the report displays the number of advancing and declining issues for the group.This is a well-designed site. Single-screen summaries enhance communication through comparison. Investors and traders familiar with market breadth indicators will find a complete list. The HotSpots section ultimately leads the user to stock selection, and navigation of the site is easy. Market HotSpots is undergoing a development change to have it integrated with MarketGauge and should be ready by the time you read this.
There is a 30-day free trial; otherwise, it's $24.95 a month. For a limited time, an annual subscription is $149 (regularly $199).
--Dennis D. Peterson, Staff Writer
Originally published in the November 2000 issue of Technical Analysis of STOCKS & COMMODITIES magazine. All rights reserved. © Copyright 2000, Technical Analysis, Inc.