NEW TECHNIQUES
One Stock Leads To Another
Market Topology
by Nicolas Vandewalle, Ph.D.
Stock W affects stock X, which in turn affects stock Y, which drives stock Z. How do you work out all the interconnectivity? By using a market tree.
No single indicator seems to represent the global (or local) structure of the market. It is possible to group stocks by sectors and to assume that stocks in the same basket are highly correlated, but doing so leaves the structure within a sector and the relationships between sectors unspecified. Is an objective representation of the market's structure possible? Could such a representation lead to a global view of the relationships between sectors or to a local view of the relationships between stocks? Knowing these relationships could provide trading advantages. Here's an indicator that might be able to help you.

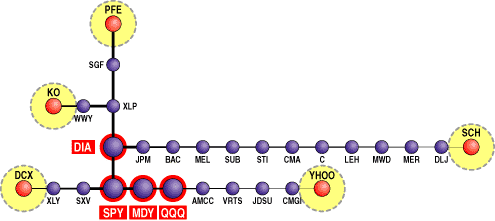
FIGURE 1: INDICES. Indices provide most of the backbone in relationships between financials (JPM through SCH) and high-tech stocks (QQQ to YHOO). Market topology objectively displays the relationships between issues.
CROSS CORRELATION COEFFICIENTS
My indicator is based on cross-correlation coefficients (Figure 1). The definition of cross-correlation between two time series can be found in any statistics textbook. This statistical tool ranges from -1 to +1. The calculation of a correlation coefficient also implies the calculation of the volatility of both series. (See the "Related resources" section at the end of this article.) A perfect positive correlation (+1) means that variations of the price of one asset are always proportional to the synchronous variations of the other. The reverse (-1) means that assets are moving in the opposite direction.
A zero determination means that the assets are statistically independent. The probability of coincident movement increases with the value of the coefficient. I thought it would be interesting to determine whether some stocks were likely to move in the same or opposite way.
Cross-correlation coefficients aren't widely used by the trading community, mainly due to a technical difficulty. The calculation of one cross-correlation coefficient is simple using a computer; the problem arises when you want to calculate any possible pair of stocks. The number of possible pairs increases quickly as the number of different stocks increases. For example, on the US stock markets (NYSE, American Stock Exchange, and Nasdaq), about 9,000 stocks are traded every day. Thus, the number of possible pairs reaches N(N-1)/2 = 40 million! Creating such a database of coefficients requires a great deal of computing time. We have done this work, and a great deal of information can be extracted from it. Depending on your resources, you may consider doing it yourself. If you're interested, here's a structure you may find valuable.
Nicolas Vandewalle, a professor at the University of Liege, Belgium, can be contacted via E-mail at nvandewalle@market-topology.com or through his Website at https://www.market-topology.com.
Excerpted from an article originally published in the December 2000 issue of Technical Analysis of STOCKS & COMMODITIES magazine. All rights reserved. © Copyright 2000, Technical Analysis, Inc.
Return to December 2000 Contents