TRADING TECHNIQUES
How To Make It Just Right
Position Sizing With Monte Carlo Simulation
by Michael R. Bryant, Ph.D.
Need to know how much to put on your next trade? You can figure it out with 95% reliability using this simulation technique.
Consider this: Jane and Joe started trading the same Standard & Poor's 500 futures trading system at the same time. They each began with $100,000 and both followed the system exactly. But 12 months later, Joe's account was worth $200,000, while Jane's account was worth only $50,000. What was the difference in their trading? Position sizing.

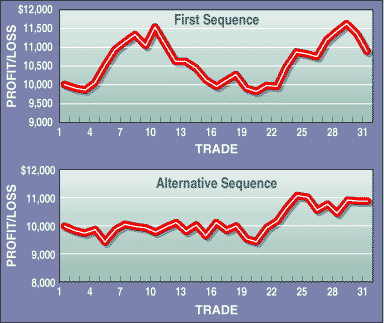
FIGURE 1: SEQUENCE. Which would you rather live through? Both trade sequences start and end at the same values and have the same trading results, but the steep drawdown for one is a proxy for risk of loss. Monte Carlo simulations estimate the probability of such an occurrence.
As his account equity increased, Joe increased the number of contracts
in a near-optimal manner, resulting in a sharp runup in equity. Jane, on
the other hand, increased her position size too quickly, so when the inevitable
string of losses occurred, her account plunged, leaving her worse off than
if she had risked less on each trade.
Both traders used a fixed-fractional approach to position sizing, in which a percentage of the account is risked on each trade. A conservative trader, for example, might risk 1% of his account on each trade.
One of the problems with fixed-fractional position sizing is that choosing the wrong fraction can be costly. If you risk too much on each trade by using a large fraction, you could end up like Jane, digging yourself out of a very deep hole. On the other hand, if you set your fixed fraction too low, you would be risking very little on each trade, and your account equity could grow much more slowly than it might otherwise. So how do you choose the best percentage possible?
ACCOUNTING FOR RANDOMNESS
Monte Carlo simulation is a way to account for the randomness in a trading parameter -- in this case, the sequence of trades. The order in which losses and gains come dictates the drawdown and thus the risk of loss (Figure 1). This order is random, and therefore, so is the risk of loss.
In Monte Carlo simulations, the basic idea is to take a sequence of trades generated by a trading system, randomize the order of trades, and calculate the rate of return and the maximum drawdown, assuming that x% of the account is risked on each trade. The process is repeated several hundred times, each time using a different random sequence of the same trades. You can then pose a question such as, "If 5% of the account is risked on each trade, what is the probability that the maximum drawdown will be less than 25%?" If 1,000 random sequences of trades are simulated with 5% risk, for example, and 940 of them have maximum drawdowns of less than 25%, then you could say the probability of achieving a maximum drawdown of less than 25% is 94% (940/1,000).
Michael R. Bryant, 310 370-4069, is an engineer and professor of medical research. He has been trading the futures markets for six years and is a registered commodity trading advisor. Currently, he is developing software and trading systems for the futures markets and offers consulting services to traders. He can be reached via his website at BreakoutFutures.com or via e-mail at mrb@BreakoutFutures.com.
Excerpted from an article originally published in the February 2001 issue of Technical Analysis of STOCKS & COMMODITIES magazine. All rights reserved. © Copyright 2001, Technical Analysis, Inc.
Return to February 2001 Contents