NOVICE TRADER
Determining Market Health
Market Breadth: Volume
by Dennis D. Peterson
Of all the market breadth measures to determine the overall health of the market, volume is perhaps one of the most difficult to use.
It only takes a few stocks to push major indices such as the Dow Jones Industrial Average, the Standard & Poor's 500, and the Nasdaq Composite up, and that's especially true for the Nasdaq Composite, which is weighted by market capitalization. To gain insight into market momentum, traders turn to market breadth indicators. Breadth measures how much of the market is participating in an index's movement. When the breadth is wide, the majority of stocks are participating. When the breadth is narrow, only a few stocks are rising or falling.

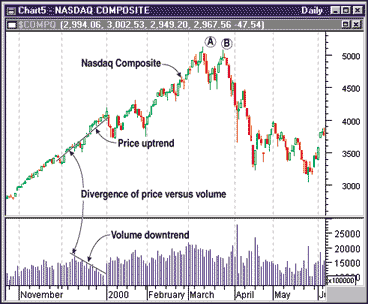
FIGURE 1: NASDAQ VERSUS UP PLUS DOWN VOLUME. During December 1999, the Nasdaq Composite continued to rise but did so while volume decreased. A price-volume divergence was created.
Up and down volume play a central role in market breadth because they measure
how bullish or bearish investors are. There are two aspects of volume that
are most important: The first is the total amount of volume and the second
is the amount of up volume versus down volume.
TOTAL VOLUME
The influence of total volume is not always obvious. It would be easy to conclude that increased up volume leads to higher price. But does higher price always mean volume is up? Not necessarily; after all, price can rise on lower volume. From a breadth standpoint, however, rising prices on lower volume indicate that enthusiasm is diminishing.
Here's a recent example of volume-price divergence. In December 1999, the sum of Nasdaq up and down volume took a noticeable downturn, while the Nasdaq Composite continued up (Figure 1). When January 2000 rolled around, the Nasdaq corrected. While this example is for the Nasdaq Composite specifically, stocks in general that rise on lowered volume are at risk for retracement.
Total volume is useful to confirm double tops or bottoms, with the expectation that the second top is reached on lowered volume. In Figure 1, the Nasdaq showed double tops on March 10, 2000 (point A), and March 24, 2000 (point B). Total volume was 2.0 billion shares on March 10 and 1.6 billion shares on March 24, thus confirming a double top.
Dennis Peterson is a Staff Writer for STOCKS & COMMODITIES.
Excerpted from an article originally published in the February 2001 issue of Technical Analysis of STOCKS & COMMODITIES magazine. All rights reserved. © Copyright 2001, Technical Analysis, Inc.
Return to February 2001 Contents