RISKGRADES.COM
Think you don't get access to the tools that investment bankers, asset managers, and Fortune 50 companies have? Well, think again, because RiskGrades.com (Figure 1) offers all these tools. What's even better is the price -- free.
FIGURE 1: RISKGRADES.COM. Here's a comprehensive risk-analysis website offering investors the ability to analyze their risks objectively.
During the last two years, RiskGrades only offered services to institutional
investors, but at the end of 1999, the company decided to develop a product
geared to individual investors. Risk is an essential part of an institutional
investor's toolbox, but unfortunately, the individual investor gives more
priority to returns and often considers risk subjectively. Here, you can
study and analyze risk in an objective manner similar to what an institutional
money manager uses.
In fact, even professional advisors can access this site through the advisor area, which offers features geared for the professional manager. The advisor area offers options that include creating up to 100 portfolios and various reporting features that make it easy to explain rebalancing decisions to clients, determine effects of interest rates, and tweak sectors and stocks to judge how to allocate among sectors. It is a more sophisticated version of the service available to individual investors.
Since the amount of information on this site is overwhelming, I recom-mend users start by visiting the online education section. This detailed course on risk is divided into the following three modules:
1 Identifying riskYou learn the significance of equity risk, interest rate risk, currency risk, and commodity risk. You also understand how RiskGrades are measured and how to use them.
2 Measuring risk
3 Managing risk
By using RiskGrades, you can easily measure the risk of single assets or your entire portfolio. RiskGrades covers international markets and analyzes risks of equities, mutual funds/trusts, bonds, equity options, and foreign currencies. Other features explained in this section include risk ranking, which compares the risk level against other securities; risk impact, which measures the amount of risk a particular position affects your portfolio; and the loss-in-extreme markets (Xloss), which measures expected losses in extreme market conditions. Knowledge of all these variables will better prepare you to use the vast number of features available on this site.
FEATURES
RiskGrades uses built-in report formats that analyze the effects of diversification, risk comparisons, volatility, and other risk-related issues on individual holdings as well as portfolios. These reports are laid out well, enabling you to quickly determine the risk factors of your portfolio. Once you create your portfolio, you will see a display similar to that in Figure 2. A risk meter tells you how risky your portfolio is and indicates whether it is aggressive or passive, what effect diversification will have on risk, and the volatility of your portfolio against the Standard & Poor's 500 index. You can view your entire portfolio using a RiskChart, return analysis, or graphical view. The difference between the three can be seen in Figure 3.
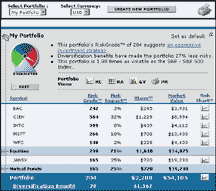
FIGURE 2: PORTFOLIO. The RiskGrade, benefits of diversification, RiskImpact, Xloss, market value, and risk charts of all holdings are displayed.
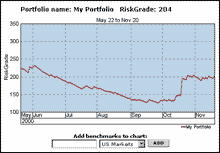
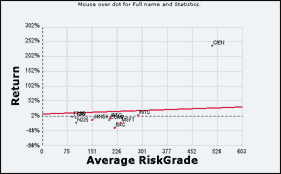
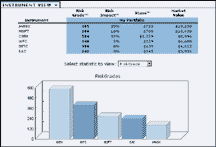
FIGURE 3: RISK CHARTS, RETURN ANALYSIS, AND GRAPHICAL VIEWS. Three types of displays can be viewed to analyze the risks and returns associated with your holdings.
Each position in your portfolio is displayed in a tabular format
showing the RiskGrade, RiskImpact, Xloss, and market value of each. You
can also view RiskCharts of each of your positions. A click on the RiskChart
icon displays the risk grade of the specific security for a selected period.
It also provides the risk ranking of the security compared to others. You
have the option of selecting the exchange or data type. You can also view
the price chart, or look at the RiskChart and price chart simultaneously
to determine the correlation between risk and price movement. Another interesting
chart is the streak chart, which is a price chart that indicates the winning
and losing streaks of the security. You can add benchmarks to each of these
charts.
Suppose your portfolio had a high risk grade that you were uncomfortable with and wanted to alter. The what-if section lets you analyze how your portfolio would be affected if you decided to sell or add holdings. After entering the changes, you run an analysis. Then you will see a graphical display (Figure 4) that analyzes the differences between the two portfolios.
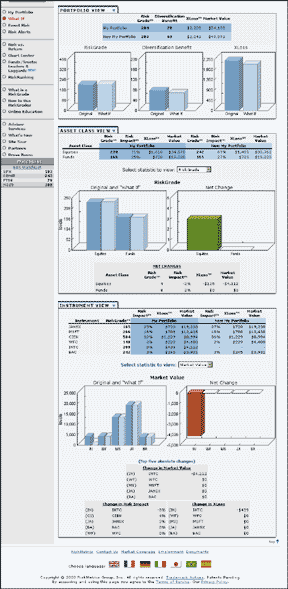
FIGURE 4: WHAT IF? What if you altered your positions? What would happen? This section gives a detailed analysis with clear charts displaying the effects of any change in your holdings.
One of the criticisms of the value-at-risk technique is that it
doesn't factor in extraordinary events. RiskGrades attempts to deal with
that. If you want to determine how your portfolio might change if it went
through certain negative historic events such as 1987's Black Monday or
the ongoing euro crisis, you can do so in the Event Risk Analysis section.
Select one of the built-in historic events, and then click the run-analysis
button.
One feature to mention is the risk alert. When the risk of your portfolio rises above a specific level, you will receive an e-mail alerting you to this change. You can set your own risk parameters that will send alerts based on whether your portfolio exceeds or goes below your set boundaries, or the risk level deviates drastically from another index or benchmark.
RETURNS
You have three options when it comes to analyzing your returns. You can view a risk versus return chart, which displays whether the returns of your holdings are above or below the level they should be, given their degree of risk. The next option is to analyze returns using ReturnGrade, which measures risk-adjusted returns. The third option is to view the streaks that show the best and worst performance and those that show the best and worst streaks -- that is, the longest stretch between a minimum and maximum point. You can analyze returns not just on individual securities but also on a basket of individual holdings or funds. A scanning tool, which lets you scan stocks or funds by exchanges, funds, managers, RiskGrades, and returns, is also included.
A recently added feature is the funds/trusts leaders and laggard area that ranks the highest or lowest in terms of ReturnGrade, average RiskGrade, or vanilla returns by various fund classes.
CONCLUSION
I encourage all those who manage their individual portfolios to visit RiskGrades. It's easy to skip the quantitative analysis of your risks, but the money management tools available on this website will change your perspective on building your portfolios.
--Jayanthi Gopalakrishnan,
Technical Editor