CLASSIC TECHNIQUES
The Basics And Tactics Of A Western Classic
High-Probability Point And Figure
by Joe Demkovich
If you want buy and sell signals from a charting system, point and figure charting may be for you.
When you purchase stock in a company, you must make two decisions. The first: Which stock should I buy? (That's fundamental analysis.) The second: When should I buy it? (That's technical analysis.) The fundamental analyst is concerned with financial statements, company history, management, earnings, dividends, industry position, and product popularity. The technical analyst is concerned with supply and demand, accumulation, and distribution. Most stocks have substantial price moves at one time or another. Before a stock price goes up, it usually goes through a period of accumulation, and before the price goes down, it usually goes through a period of distribution. Point and figure (PNF) displays highlight this behavior.

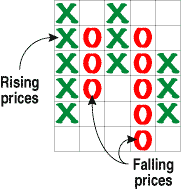
FIGURE 1: BASIC POINT AND FIGURE. The basic PNF chart of a rising price shows a column of Xs. A column of Os means the stock is falling. Columns of Xs and Os alternate back and forth; they never appear in the same column. Price must swing at least three points (or boxes) to reverse from one direction to the other.
TIMING
Assuming you are satisfied with the fundamentals of the company, you should buy the stock only when the market, the industry group, and the stock are in an uptrend. Conversely, you should sell when the market, the industry group, and the stock are in a downtrend.
Many technical analysts primarily use charts to determine trends -- charts of the stock, the market, the industry group, or an index. There are four main types of charts: line, bar, candlestick, and point and figure. Point and figure is one of the oldest charting formats used to chart the markets.
BASICS OF POINT AND FIGURE CHARTING
The basic PNF chart (Figure 1) of a rising price shows a column of Xs. A column of Os means the stock is falling. Columns of Xs and Os alternate back and forth; they never appear in the same column. Price must swing at least three points (or boxes) to reverse from one direction to the other. For example, if a stock were trading upward in a column of Xs, each box being $1, with a top of $50, it would take a move to $47 (intraday or on close, your choice) to reverse the chart to Os. Going in the other direction, if a stock were trading downward in a column of Os, each box being $1, with a current low of $45, it would need a rally to $48 to reverse the stock to a column of Xs. (For a detailed explanation, see sidebar "Point and figure technique.")
Each X or O represents a movement in the price of the stock. For prices below the $100 level, each X or O represents $1. For prices above the $100 level, each X or O represents $2. The size of the boxes is up to the analyst.
PNF doesn't have a time axis the way most charts do, though many analysts make notes on the chart of the times that things occur. The basic chart is purely a measure of supply and demand. ...Continued in the April 2001 issue of Technical Analysis of STOCKS & COMMODITIES
Joe Demkovich is a retired IBM manager and has been teaching investing courses for several years. He is a partner in options investing with Gene Theriot. He may be contacted via e-mail at
puggy@worldnet.att.net.
Excerpted from an article originally published in the April 2001 issue of Technical Analysis of STOCKS & COMMODITIES magazine. All rights reserved. © Copyright 2001, Technical Analysis, Inc.
Return to April 2001 Contents