TRADING TECHNIQUES
Quo Vadis?
Analyzing Trends In Momentum
by Martin J. Pring
Momentum pure and simple is fine, but how about the trend of momentum? Here's what it can tell you.
Momentum is a generic term that applies to all oscillators, and the principles of momentum interpretation can in general be applied to all oscillators in one way or another. These interpretations are susceptible to overbought/oversold conditions, divergences, and so forth. However, there is an even more useful interpretive technique that can be applied to momentum, and that is to analyze the actual trend of the oscillator.

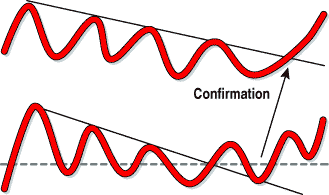
FIGURE 1: TREND IN MOMENTUM. Nearly all oscillators show trends, and momentum is no exception.
First, it is important to understand that momentum, just like price, moves
in trends. This means that the trend-determining techniques used in price
trend analysis work just as well with momentum trends. Even so, we must
bear in mind that a reversal in the trend in momentum is usually, but not
always, associated with a similar reversal in the price itself. Here
are some trend-reversal techniques that can help you get a better fix on
using momentum interpretation for greater profits.
TRENDLINES
Trendlines are perhaps the most easily invoked tool of technical analysis. After all, it is a relatively simple matter to pull out a ruler and draw a line connecting a series of peaks or troughs. Indeed, I never cease to be amazed at the effectiveness of this approach, despite its simplicity.
Figure 1 represents a momentum series for which it is possible to construct a trendline joining several momentum tops. The idea is that when the trendline is violated, the downtrend in momentum is reversed. This, of course, only tells us about momentum; it tells us nothing about the trend in price. For that, we must isolate some kind of trend reversal there as well. One of the most effective techniques in this regard is to match a trendline violation in momentum with one in price. When both are penetrated, the market usually reverses trend, or at the very least consolidates for a while. In effect, the momentum signal represents additional confirmation in our "weight of the evidence" theory of trend reversals discussed in earlier articles.
The opposite would be true in an uptrend. Figure 2, for instance, features
a trendline that joins a series of momentum bottoms. When that line is
penetrated, it indicates that the trend of momentum has probably reversed
as well. However, since we cannot buy and sell momentum, we must wait for
some kind of price confirmation. This can take the form of any legitimate
trend-reversal technique, such as a moving average crossover or a price
pattern completion. My favorite, though, is the trendline, as shown in
Figure 2.
...Continued in the April 2001 issue of
Technical Analysis of STOCKS & COMMODITIES
Martin J. Pring founded the International Institute for Economic Research in 1981. He pioneered the introduction of videos as an educational tool for technical analysis in 1987 and was the first to introduce educational interactive CDs in this field. His website is www.Pring.com, and he may be reached at info@Pring.com.
Excerpted from an article originally published in the April 2001 issue of Technical Analysis of STOCKS & COMMODITIES magazine. All rights reserved. © Copyright 2001, Technical Analysis, Inc.
Return to April 2001 Contents