TRADING TECHNIQUES
Pinpoint This Pattern
The Butterfly Setup
by Rudy Teseo
There's more than one way to use harmonic patterns to find likely buy/sell candidates.
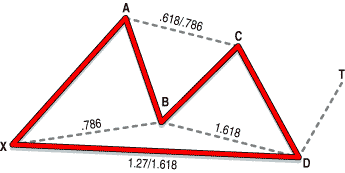
If you've looked for Gartley patterns while scrolling through your charts, it's more than likely that you've discovered some patterns that resemble the Gartley but slant downward rather than upward, the way that the Gartley setup does. This pattern -- sort of Gartley, sort of not -- is known as the butterfly. Like the Gartley, it comes in two forms, bullish and bearish.

FIGURE 1: BUTTERFLY DIAGRAM. Gartley setups slant upward, but butterfly setups slant downward.
The bullish butterfly is similar to the Gartley. However, although the same ratios are used as the Gartley setup -- 61.8, 78.6, 1.27, and 1.618 -- they occur at different parts of the pattern. This results in a point D that is lower than point X, as can be seen in Figure 1. But I should note that this is an ideal pattern; not all ratios will match the ideal in the real world, even though the pattern is a legitimate butterfly.
TUTORIAL
You can compute all the targets in a butterfly setup using the spreadsheet
in Figures 2 and 3. I'll step through the creation of the chart pattern
and spreadsheet model. If you're using this article as a tutorial, it will
help to have both your chart (Figure 4) and your spreadsheet on screen.
Then construct the chart and enter the spreadsheet data as I give it. (Switching
back and forth is easy with alt+tab.)
...Continued in the April 2001 issue of
Technical Analysis of STOCKS & COMMODITIES
Rudy Teseo is a retired communications and computer consultant. He has also taught courses in investing, technical analysis, and options trading. He may be contacted via e-mail at Rftess@juno.com.
Excerpted from an article originally published in the April 2001 issue of Technical Analysis of STOCKS & COMMODITIES magazine. All rights reserved. © Copyright 2001, Technical Analysis, Inc.
Return to April 2001 Contents