Traditional market indicators are typically based on price. Moving averages, for example, are calculated using a specific number of bars of price history. Traditional indicators can be useful for gauging price action in the market, but I wanted indicators to measure how my system was performing. So I tried out a combination of indicators based on the profit/loss stream of a trading system.
These money management indicators are plotted on a price chart just as any other indicators. But instead of being used to analyze the market, they analyze trading systems and provide information about how a trading system is responding to the market. They are particularly useful for risk and position management. In effect, money management indicators are derivative indicators, since they are based on how the trading system responds to the market rather than on the market itself.
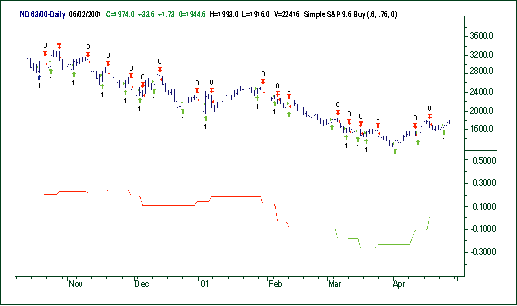
Figure 1: Average trade indicator (N=20) for an e-mini Nasdaq100 trading system. The green area of the indicator line is where the average of the last 20 trades is significantly less (within a 95% confidence level) than the overall average trade.
WHAT MAKES THEM UNIQUE?
Generally, system performance measures are calculated using the entire trade history. The indicators I created are calculated using the most recent trades going back a specific number of trades. This is similar to the way price-based indicators are calculated, which specify the number of days. Because they use only the more recent trades, these money management indicators represent the most recent behavior of the system.
It is well known that financial markets are dynamic; that is, the properties of the markets change over time. Money management indicators capture this dynamic behavior because they are updated after each new trade and represent only the most recent trades. This gives them the ability to detect the most recent market behavior.
Virtually any measure of system performance can be used in a money management indicator, provided it is based on the sequence of profits and losses from a trading system. The most basic such an indicator is a simple moving average of the profit and losses of a system - the average of the last N number of trades. Others are based on the momentum of the equity curve, the percentage of profitable trades, and a runs test indicator. A discussion of each of these indicators follows. You will find that all of these indicators contain an input N that represents the moving window of trades used to calculate the indicator value.
...Continued in the October 2001 issue of Technical Analysis of STOCKS & COMMODITIES
Michael R. Bryant, Ph.D., has a background in engineering and biomedical research. He trades stock index futures for his own account. He also offers software, trading systems, and consulting services to traders through his website at BreakoutFutures.com. He can be reached via e-mail at mrb@BreakoutFutures.com or by phone at 310 370-4069.
Excerpted from an article originally published in the October 2001 issue of Technical Analysis of STOCKS & COMMODITIES magazine. All rights reserved. © Copyright 2001, Technical Analysis, Inc.
Return to October 2001 Contents