TRADING TECHNIQUES
Time Your Trade With This System When The S&P Is Basing
Position Trading The S&P
by Clifton Mitchell, Ph.D.
Use linear regression to predict short-term trend changes of the Standard & Poor's 500.
Psychologically speaking, bar chart lows represent the lowest price that sellers are willing to take for a security or commodity. If sellers are not willing to go lower on their selling price, then buyers must pay more and, consequently, prices rise. This is why a series of higher lows has long been accepted as a general indicator of prices moving higher. Evidence of this is most commonly seen when trendlines indicating upward movement are drawn such that they touch the lows of uptrending bar charts. Trends with more higher lows than lower lows can easily be recognized after they have developed. Often, however, this is too late in the move to use as a buy signal, particularly for the short-term position trader. By the time the trend is evident, most of the move is over.
Sadly, buying every time a higher low appears is a futile trading approach. This is because the appearance of higher lows is too random for this simple pattern to be a good buy indicator. A system trader will have problems determining which higher lows are indicative of a trend change and which should be discarded. To solve this problem, you must find a filter that eliminates those higher lows that are not likely to be signaling a trend change and denoting those higher lows that constitute worthy buy signals.
The system presented here uses linear regression as a filter to determine which higher lows are likely to be indicative of a short-term trend reversal in the Standard & Poor's 500. The benefits and drawbacks of three different exit strategies are also examined relative to this entry filter.
LINEAR REGRESSION BASICS
Linear regression is a mathematical approach used to determine which straight line drawn through a series of points on a chart best fits the overall position of those points. Just as an average can be considered to be one number that best represents a group of numbers, a linear regression is the one line that best represents a group of numbers on a chart - the "goodness of fit."

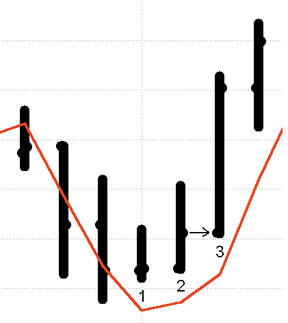
Figure 1: THE BUY SETUP. At bar 1, the linear regression of the lows (red line) continues down, even though the low was higher than previous bar's low. The bar 2 low is higher than the regression low of bar 1, creating a buy setup. Buy on day 3 at close stop, as indicated by arrow.
...Continued in the October 2001 issue of Technical Analysis of STOCKS & COMMODITIES
Clifton Mitchell holds a doctorate in counseling psychology and teaches graduate counseling at East Tennessee State University in Johnson City, TN. He is interested in contacting other traders in his area and can be reached via e-mail at cliftlin@preferred.com.
Excerpted from an article originally published in the October 2001 issue of Technical Analysis of STOCKS & COMMODITIES magazine. All rights reserved. © Copyright 2001, Technical Analysis, Inc.
Return to October 2001 Contents