![]()
www.eCharts.com
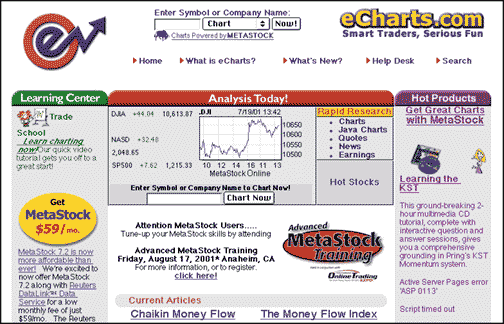
eCharts.com (Figure 1) is an extension of Equis, the Reuters company that produces MetaStock, the technical analysis program made for investors. eCharts targets multiple audiences: there is a learning center for novice traders, free stock analysis for chartists, and market updates and community chat groups for everyone in between. The eCharts market commentary is provided by veteran traders, including S&C former Editor Thom Hartle, as well as John Bollinger, Jay Kaeppel, John Murphy, Martin Pring, Joe Duarte, Mike Hurley, and Len Yates.

Figure 1: echarts. eCharts, an extension of Equis, the Reuters company that produces MetaStock, the technical analysis program for investors, provides charting, screening, instruction, and research.
THE LEARNING CENTER
The novice trader's first stop should definitely be the Learning Center. Here, you'll find a video tutorial in which Thom Hartle takes you through the basics of charting and indicators. The complicated and sometimes mundane technical analysis terminology is explained with clarity and depth. You'll feel sort of like a modern-day Dante - with a trader Virgil as your guide. The Learning Center also includes a Trader Optimization Profile by trading coach Mark Douglas to help you discover your "trading personality." (For example, if you're still writhing because the dollar is no longer backed by gold, a hedge fund is not for you.) A profile is useful because it not only determines what strategies you should not use, but also tailors a trading strategy that complements your personality traits. You can make the most out of your investments and not suffer a stroke while doing so.
FREE ANALYSIS AND CHARTS
Another great thing about eCharts is the free access to Java charting applications. Simply type in a ticker symbol on eCharts' homepage and receive instant quotes and price display. You can also customize time period as well as overlay with indicators. eCharts gives you everything from accumulation/distribution to stochastics to Williams' %R. For more in-depth research, earnings and company news is also provided for your stock. Since Steven Achelis, author of the trader's bible, Technical Analysis From A To Z, is the founder of Equis, you can find his book here free along with a trader's glossary and tips.
Available at eCharts is daily commentary about happenings in the marketplace. In addition, the Market Datebook option provides briefings on monthly release dates and fundamental reports from governments and private agencies. Two full-length educational articles are published weekly with insights into technical analysis. Further, eCharts also hosts discussion forums so you can talk with other traders and gauge market sentiment locally or globally. Reuters backing also comes in handy, providing a reliable source of financial information.
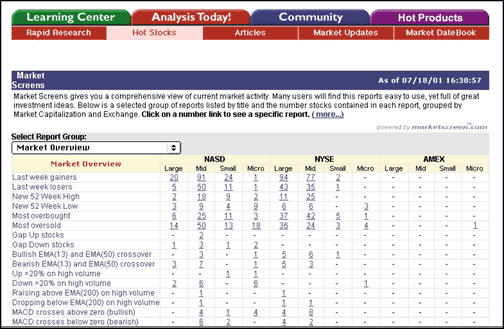
When perusing eCharts, be sure to look at the Hot Stocks Report (Figure 2). Here, eCharts lists weekly stocks that are the biggest percent gainers and biggest percent losers. There are also many other rankings, such as most overbought and most oversold stocks, most volatile, as well as stocks crossing (above or below) their 200-day moving average. Calculations on volume, moving average convergence/divergence (MACD), and exponential moving average (EMA) are done as well. For traders who use such indicators, Hot Stocks will save you time and money.

Figure 2: Hot Stocks. When perusing eCharts, be sure to look at the Hot Stocks Report. Here, eCharts lists weekly stocks that are the biggest percent gainers and biggest percent losers.
SHOPPING AND FUN
All the charting on eCharts is powered by MetaStock, Equis's software for technical analysis. If you want better charting ability and more thorough stock analysis, you can purchase MetaStock for your personal computer. MetaStock offers more than 120 indicators, nine different charting styles, and dozens of other features. On the eCharts website, browse the catalog provided through a secure server to find other investment analysis products.
Finally, you must take a look at the cartoons by humorist Pat Bagley. If you think there is no humor in trading, stock markets, and investing (not terribly hard to believe), Bagley's cartoons will be a pleasant surprise. His entire archive is listed underneath his author profile.
SUMMARY
eCharts is a handy website that every trader should bookmark. Whether you're just starting to learn technical analysis or you're a seasoned trader doing some thorough research, eCharts provides a ready reference.
-Amy Wu, Editorial Intern
MrSwing.com
A swing is a measurement of price movement that is usually opposite of the previous price movement. Swing trading takes advantage of the fact that the market is cyclic, even during trends. For instance, during a seven-day uptrend of a security, there's still bound to be three or four down days. By carefully entering and exiting trends based on the market cycle, swing traders can capitalize their gains. Unlike daytrading, swing trading occurs by following the intraweek price changes of a security. These changes are often triggered by movements in market sentiment; thus, swing traders trade on short-term deviations in emotional behavior. Swing trades can last anywhere from a few days to over a week, depending on the length of the trend and of the swing.
MrSwing.com distinguishes two type of swings: long and short. Long swings identify opportunities to buy stocks that are in clear uptrends. Since an uptrend is a series of higher highs and higher lows, long swings would allow the purchase of a stock during a pullback or a "higher low." Buying during this time gives the trader a comparative discount to previous prices. The technique used to enter the market during an uptrend is called a trailing buy-stop. During a security's higher low, a buy order is activated 1/16 above the high of the previous day. What this means is, if prices do break out, the trader will be stopped slightly above the high of the day before. Otherwise, the buy-stop will not be touched.

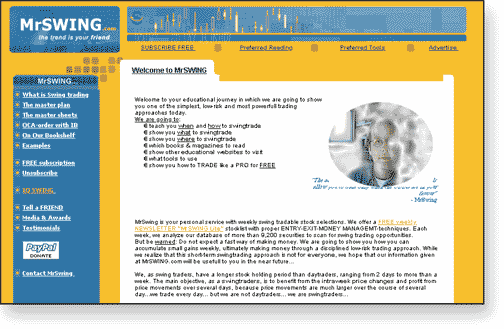
Figure 1: mrswing.com
Short swings help find shorting opportunities in downtrends. Since a downtrend is a series of lower highs and lower lows, traders can cut their losses by selling during one of the minor downtrend rallies. These increases can also be used to enter the market through a technique called the trailing sell-stop. When a security is in a downtrend but the daily trend rallies, a trailing sell-stop is activated by an order to sell short 1/16 below the low of the day before. When the trend goes beyond the low of the previous day, the trader will be stopped short. Otherwise, the sell-stop will not be touched.
STOCKPICKS AND A MASTER PLAN
Besides instructing you on how to swing trade, MrSwing also provides a free weekly newsletter with its stockpicks. Once you subscribe on its website, you will receive this newsletter, which also includes its suggestions for entry and exit during swings. The stockpicks are divided into long swings and short swings, along with caveats such as "buying after the open is better." Besides these techniques, the website includes recommendations for long and short gap entries. There's also a money management system, dubbed the "master plan," to keep you disciplined during trades and time proper exits. (See Figure 1.) For example, they tell you to place a stop-loss order the moment you enter and exit as soon as you hit a 4% loss, reminding you that swing trading opportunities are manifold. MrSwing also has a 50% rule that says from the moment you accrue a 7% gain on long swing trades, you ought to buy/sell 50% of the shares. For gaps, the trader should be prepared to sell his or her positions if the stock gaps up (long swings) and cover the short positions if the stock gaps down (short swings).
As with most trading systems, though, it comes down to whether the trader
can maintain his or her discipline. Being irrationally exuberant or too
bearish can cause him to substitute emotional impulses for consistency.
Even deviating once or twice from this master plan - as is true for any
other trading system - can be disastrous. If you want a sample of MrSwing's
newsletter, check out the testimonials on the homepage. Most reiterate
the sentiment that the trading system allowed them to stop trading on emotional
impulses. MrSwing also provides money management techniques and entry/exit
suggestions in a downloadable Excel format, which you can download from
"Mastersheets." Although the subscription to the newsletter is
free, you can order books on swing trading and technical analysis from
the site
as well.
SUMMARY
While you should still do your own research on swing trading and on the suggested stockpicks, MrSwing is a very informative, easy-to-read website. Since the newsletter is free, it can't hurt to go over the stockpicks and examine the trading system provided. The disclaimer states that the developer receives no benefits from the stocks picked. So even if you don't agree with all their picks, you can be assured they have no ulterior motive for being there. If you have some time and money on your hands, drop by MrSwing.com and give swing trading a try.
-Amy Wu, Editorial Intern
Originally published in the October 2001 issue of Technical Analysis of STOCKS & COMMODITIES magazine. All rights reserved. © Copyright 2001, Technical Analysis, Inc.