Seasonal Trading
The Bad, The Good, And The Profitable
by John L. Momsen
Here's why you have to research your trades as thoroughly as possible.
February 2003, I received an intriguing email from one of my friends. He said he had discovered a nearly perfect, 94% profitable, seasonal trade in the orange juice market and wanted my opinion on it. This certainly piqued my interest: I've been a trader of seasonal commodity trades for more than 20 years, and I've written both books and articles on the subject. So what was this seasonal trade? "Buy May orange juice on the close of February 26 and exit the trade on the close of March 17."
THE BAD
My friend wanted my opinion, so I needed to analyze the trade. My original excitement was diluted when I found out the seasonal had only been studied for the last 17 years. Orange juice has been trading a lot longer than that, and I believe strongly in using the greatest amount of data available to test any seasonal trade.
Second, the relative short time period of the trade bothered me. In my experience, few seasonal trades that last less than a month end up being profitable. Often, they are just mathematical chance happenings that occur when an entry day price is lower than the exit day's price. These trades are mostly computer-generated and are rarely true seasonals.
Finally, I wondered about the fundamentals behind this seasonal trade. As I just pointed out, a lack of fundamentals is often the footprint of a computer-generated trade. Any real or profitable seasonal trade always has a firm fundamental foundation that drives the price in the expected seasonal direction.
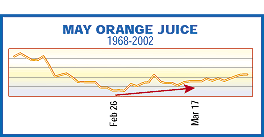
With these questions in mind, I decided that the first test I would perform on the seasonal was to construct a long-term seasonal chart using the data I had on hand (1968-2002). The results can be seen in Figure 1. Notice the arrow shows a slight uptrend during the suggested entry-to-exit time period. But also notice that the uptrend is not very strong. This suggests an obvious problem. Since this trend was extremely strong in the last 17 years, something must have gone wrong in the years before.

Figure 1: May orange juice (1968-2002). This 35-year seasonal chart of May orange juice shows a slight seasonal uptrend from February 26 to March 17.
Excerpted from an article originally published in the May 2004 issue of Technical Analysis of STOCKS & COMMODITIES magazine. All rights reserved. © Copyright 2004, Technical Analysis, Inc.
Return to May 2004 Contents