Identifying Sectors To Trade
Ranked Relative Strength
by Jeff Parent
How do you know which sectors to trade? Here's a system that will identify the strongest sectors so you know what you should be chasing.
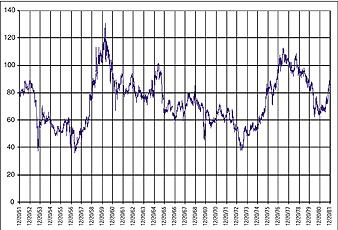
When Charles Dow started recording his average in the late 19th century (Figure 1), the markets were essentially a one-horse show. Transportation-related stocks dominated the blue-chip segment of the markets and were the most actively traded. Dow used them as a proxy to gauge economic conditions. He measured the simple average price of a basket of predominantly railroad stocks and compared the result to the 100 level. This may seem unusual, but until October 13, 1915, stocks were quoted as a percentage of their par value, which was typically $100 anyway. Besides having par value in common, companies had similar capital structures and dividend policies, so the 100 level was a natural reference point.

Figure 1: 12-stock price average from 1851 showing how prices moved around the 100 level. This is what Charles Dow might have seen if he started calculating his average earlier.
Charles Dow went further by writing about the movements of his average. Much of technical analysis is based on his observations. The ideas of trends, retracements, reversal points, and cycles were all common topics in his editorials.
SINCE THEN...
A lot has changed over the past century. Economic moderators have been introduced over the years. Social security programs, public insurance, and risk diversification tools abound. Monetary policy is aggressive. The market structure is carefully managed. Disclosure rules are stricter. Dissemination of news is faster and timely. Earnings are more likely to be retained than paid out. All of this has undoubtedly had an impact on the markets. Arguably, risk and wealth are more evenly distributed. The economy is more layered and less interconnected. At any point in time, there are strong and weak sectors. In other words, it is possible to have many concurrent business cycles. What does all this mean for us?
For investors, it's great news. We have risk reduction through economic diversity in the stock markets. But in a diversified index calculation, movements in disparate and often unrelated or uncorrelated sectors can move against each other. Information is masked. Opportunities are lost. The market technician's macro tool, the broad market index, has lost its effectiveness. Markets may be moving up or down, and you may see big cycles in general price movements, but there will always be a stock or sector not going with the trend.
How do you break down the markets into sector constituents to find the
countertrend sector? For that matter, how do you find the strong
sectors?
...Continued in the May issue of Technical Analysis of STOCKS & COMMODITIES
Excerpted from an article originally published in the May 2004 issue of Technical Analysis of STOCKS & COMMODITIES magazine. All rights reserved. © Copyright 2004, Technical Analysis, Inc.
Return to May 2004 Contents