Is The Traditional Measuring Formula Still Relevant Today?
Measuring Flags And Pennants
by Markos Katsanos
This new statistically derived formula can help you estimate price targets more accurately.
Flags and pennants are my favorite formations, and I have used them in my trading for some time. In using them, I found that my exit strategy and profit objective was far from optimal. The classical method used for measuring these common and useful formations is simple and straightforward, but how accurate and reliable is it? It's difficult to find technical literature that provides any statistical studies on the subject. In fact, it is Robert Edwards & John Magee's classic Technical Analysis Of Stock Trends, that standard of the industry, that provides the measuring formula and most other information on the subject. Given the limited amount of statistical studies on the subject, I decided to investigate.
I found 100 flag, pennant or similar short-term consolidation patterns for the past two years (2003-04) using daily charts. My criteria for including a pattern in the list was, first of all, a steep and quick price rise leading to the formation of no less than 20% from the lowest point of the flagpole. I excluded bearish flags that formed after a declining price trend from the current study. I then made a note of the price level and the date of the lowest and highest point of the pole, the point where prices break out above the upper trendline of the formation, and the breakout up to the first short-term top. I also noted the volume trend during the formation pattern.
Statistical analysis of the results revealed some surprising findings contradicting widely accepted principles. In this article, I will discuss the measuring formula and formation characteristics such as volume and pattern length among others.
FORMATION CHARACTERISTICS
Flags and pennants can be categorized as continuation patterns because they break out only in the prevailing trend. This is an important trading advantage over similar formations such as triangles, because the direction of the breakout is known in advance. They usually represent only brief pauses in a dynamic market and are typically seen right after a steep, quick move.

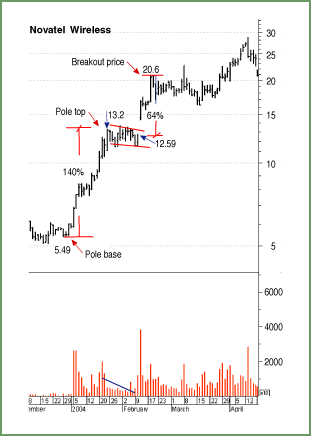
FIGURE 1: FLAG. On February 10, 2004, Novatel Wireless (NVTL) broke out from a flag formation. Note the volume decline in the bottom window depicted by volume linear regression line (in blue).
Excerpted from an article originally published in the April 2005
issue of Technical Analysis of STOCKS & COMMODITIES magazine.
All rights reserved. © Copyright 2005, Technical Analysis,
Inc.
Return to April 2005 Contents